| Param | Original file | Final file |
|---|---|---|
| Filename | modeM0/AS1G06_139T01_9000000700cztM0_level2_bc.evt | modeM0/AS1G06_139T01_9000000700cztM0_level2_quad_clean.evt |
| Size (bytes) | 1,211,800,320 | 400,432,320 |
| Size | 1.1 GB | 381.9 MB |
| Events in quadrant A | 6,649,751 | 2,491,995 |
| Events in quadrant B | 8,061,444 | 2,492,981 |
| Events in quadrant C | 8,310,916 | 2,471,384 |
| Events in quadrant D | 11,412,140 | 2,392,266 |
| Mode SS | |||
|---|---|---|---|
| Quadrant | BADHDUFLAG | Total packets | Discarded packets |
| A | 0 | 678 | 0 |
| B | 0 | 678 | 0 |
| C | 0 | 678 | 0 |
| D | 0 | 678 | 0 |
| Mode M0 | |||
|---|---|---|---|
| Quadrant | BADHDUFLAG | Total packets | Discarded packets |
| A | 0 | 69240 | 0 |
| B | 0 | 73170 | 0 |
| C | 0 | 75190 | 0 |
| D | 0 | 85378 | 0 |
| Mode M9 | |||
|---|---|---|---|
| Quadrant | BADHDUFLAG | Total packets | Discarded packets |
| A | 0 | 78 | 0 |
| B | 0 | 78 | 0 |
| C | 0 | 78 | 0 |
| D | 0 | 78 | 0 |
| Quadrant | Total seconds | Saturated seconds | Saturation percentage |
|---|---|---|---|
| A | 33174 | 464 | 1.398686% |
| B | 33174 | 537 | 1.618738% |
| C | 33171 | 921 | 2.776522% |
| D | 33173 | 1130 | 3.406385% |
Noise dominated data is calculated using 1-second bins in cleaned event files. If a bin has >2000 counts, and if more than 50% of those come from <1% of pixels, then it is considered to be noise-dominated and hence unusable.
| Quadrant | # 1 sec bins | Bins with >0 counts | Bins with >2000 counts | High rate bins dominated by noise | Noise dominated (total time) | Noise dominated (detector-on time) | Marked lightcurve |
|---|---|---|---|---|---|---|---|
| A | 41005 | 33175 | 0 | 0 | 0.00% | 0.00% |  |
| B | 41005 | 33177 | 16 | 16 | 0.04% | 0.05% |  |
| C | 41005 | 33176 | 69 | 69 | 0.17% | 0.21% |  |
| D | 41005 | 33175 | 94 | 94 | 0.23% | 0.28% |  |
Top three noisy pixels from each quadrant. If the there are fewer than three noisy pixels in the level2.evt file, extra rows are filled as -1
| Pixel properties | Quadrant properties | ||||||
|---|---|---|---|---|---|---|---|
| Quadrant | DetID | PixID | Counts | Sigma | Mean | Median | Sigma |
| A | 13 | 6 | 40838 | 105.24 | 1692 | 1654 | 372.3 |
| A | 0 | 50 | 38832 | 99.85 | 1692 | 1654 | 372.3 |
| A | 13 | 251 | 30418 | 77.25 | 1692 | 1654 | 372.3 |
| B | 15 | 204 | 821520 | 2516.7 | 1703 | 1656 | 325.8 |
| B | 11 | 51 | 170099 | 517.06 | 1703 | 1656 | 325.8 |
| B | 7 | 252 | 127857 | 387.39 | 1703 | 1656 | 325.8 |
| C | 9 | 247 | 1484564 | 4159.7 | 1643 | 1621 | 356.5 |
| C | 1 | 241 | 259809 | 724.22 | 1643 | 1621 | 356.5 |
| C | 1 | 16 | 115002 | 318.04 | 1643 | 1621 | 356.5 |
| D | 2 | 152 | 2081955 | 5423.95 | 1667 | 1607 | 383.5 |
| D | 9 | 85 | 1013086 | 2637.16 | 1667 | 1607 | 383.5 |
| D | 8 | 195 | 571090 | 1484.77 | 1667 | 1607 | 383.5 |
Histogram calculated using DETX and DETY for each event in the final _common_clean file
| Quadrant A | 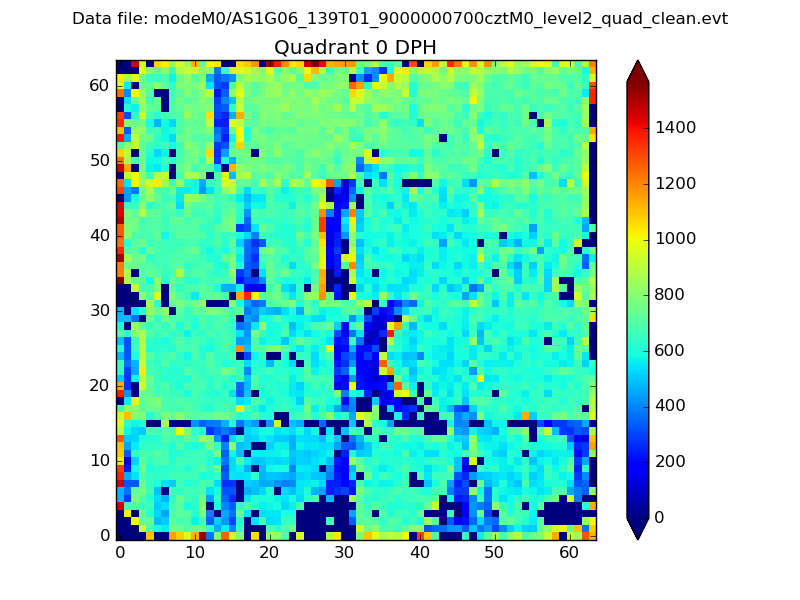 |
 |
Quadrant B |
|---|---|---|---|
| Quadrant D |  |
 |
Quadrant C |
| Plot type | Count rate plots | Images |
|---|---|---|
| Comparison with Poisson distribution Blue bars denote a histogram of data divided into 1 sec bins. Red curve is a Poisson curve with rate = median count rate of data. |
 |
 |
| Quadrant-wise count rates Data is divided into 100 sec bins |
 |
|
| Module-wise count rates for Quadrant A Data is divided into 100 sec bins |
 |
 |
| Module-wise count rates for Quadrant B Data is divided into 100 sec bins |
 |
 |
| Module-wise count rates for Quadrant C Data is divided into 100 sec bins |
 |
 |
| Module-wise count rates for Quadrant D Data is divided into 100 sec bins |
 |
 |
| Parameter | Plot |
|---|---|
| CZT HV Monitor |  |
| D_VDD |  |
| Temperature 1 |  |
| Veto HV Monitor |  |
| Veto LLD |  |
| Alpha Counter | 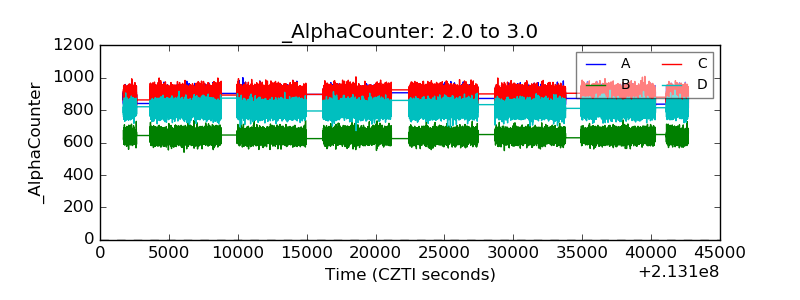 |
| _CPM_Rate |  |
| CZT Counter |  |
| +2.5 Volts monitor | 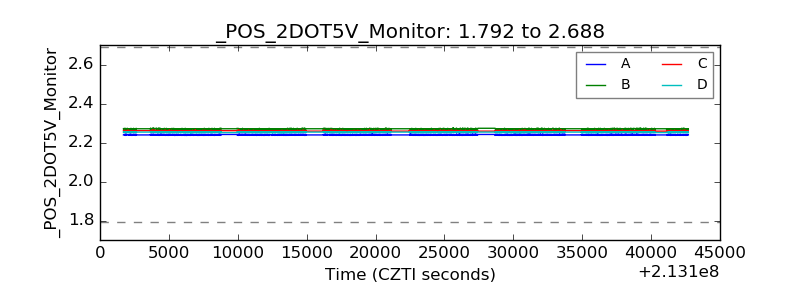 |
| +5 Volts monitor |  |
| _ROLL_ROT | 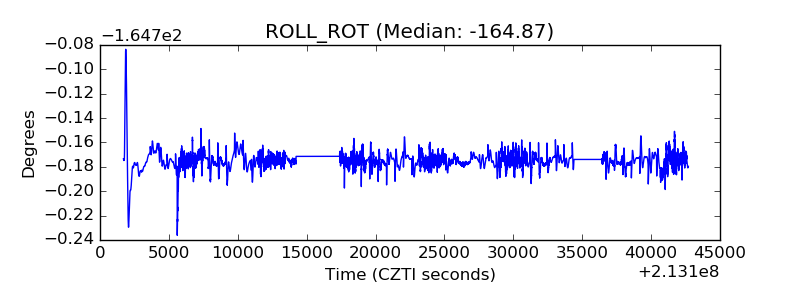 |
| _Roll_DEC |  |
| _Roll_RA |  |
| Veto Counter | 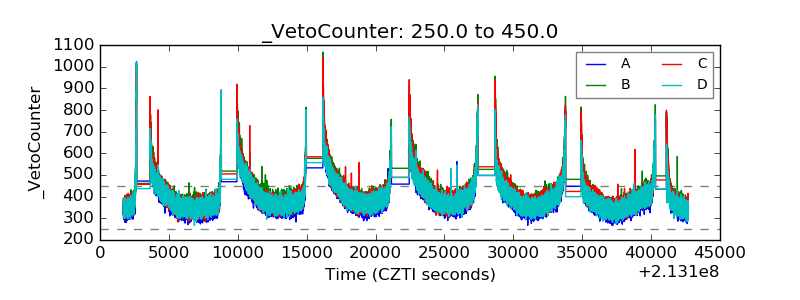 |