| Param | Original file | Final file |
|---|---|---|
| Filename | modeM0/AS1A02_063T01_9000000702cztM0_level2.evt | modeM0/AS1A02_063T01_9000000702cztM0_level2_quad_clean.evt |
| Size (bytes) | 2,576,485,440 | 462,228,480 |
| Size | 2.4 GB | 440.8 MB |
| Events in quadrant A | 16,545,591 | 2,936,671 |
| Events in quadrant B | 19,485,537 | 2,959,667 |
| Events in quadrant C | 21,302,296 | 2,817,108 |
| Events in quadrant D | 18,207,584 | 2,757,470 |
| Mode M9 | |||
|---|---|---|---|
| Quadrant | BADHDUFLAG | Total packets | Discarded packets |
| A | 0 | 42 | 0 |
| B | 0 | 41 | 0 |
| C | 0 | 40 | 0 |
| D | 0 | 43 | 0 |
| Mode M0 | |||
|---|---|---|---|
| Quadrant | BADHDUFLAG | Total packets | Discarded packets |
| A | 0 | 75472 | 0 |
| B | 0 | 82300 | 0 |
| C | 0 | 88915 | 0 |
| D | 0 | 80167 | 0 |
| Mode SS | |||
|---|---|---|---|
| Quadrant | BADHDUFLAG | Total packets | Discarded packets |
| A | 0 | 754 | 0 |
| B | 0 | 743 | 0 |
| C | 0 | 752 | 0 |
| D | 0 | 746 | 0 |
| Quadrant | Total seconds | Saturated seconds | Saturation percentage |
|---|---|---|---|
| A | 36947 | 354 | 0.958129% |
| B | 36703 | 525 | 1.430401% |
| C | 36685 | 1652 | 4.503203% |
| D | 36790 | 520 | 1.413428% |
Noise dominated data is calculated using 1-second bins in cleaned event files. If a bin has >2000 counts, and if more than 50% of those come from <1% of pixels, then it is considered to be noise-dominated and hence unusable.
| Quadrant | # 1 sec bins | Bins with >0 counts | Bins with >2000 counts | High rate bins dominated by noise | Noise dominated (total time) | Noise dominated (detector-on time) | Marked lightcurve |
|---|---|---|---|---|---|---|---|
| A | 50637 | 38685 | 3 | 3 | 0.01% | 0.01% | 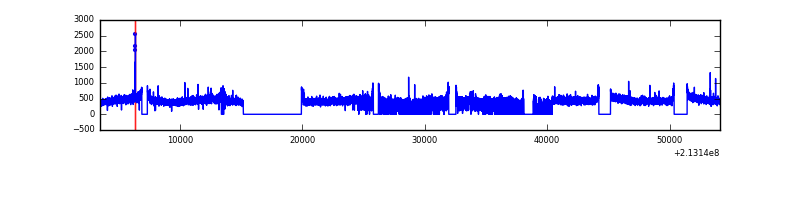 |
| B | 50637 | 38493 | 68 | 68 | 0.13% | 0.18% |  |
| C | 50637 | 38555 | 1133 | 1133 | 2.24% | 2.94% |  |
| D | 50637 | 38607 | 200 | 200 | 0.39% | 0.52% | 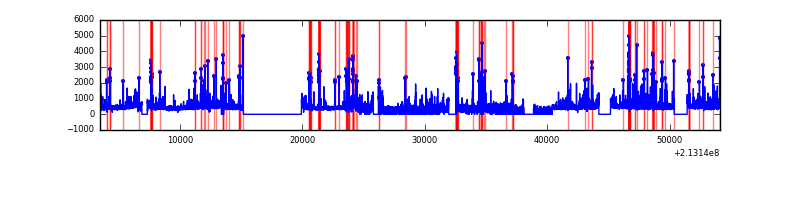 |
Top three noisy pixels from each quadrant. If the there are fewer than three noisy pixels in the level2.evt file, extra rows are filled as -1
| Pixel properties | Quadrant properties | ||||||
|---|---|---|---|---|---|---|---|
| Quadrant | DetID | PixID | Counts | Sigma | Mean | Median | Sigma |
| A | 15 | 234 | 73617 | 80.06 | 4266 | 4171 | 867.5 |
| A | 12 | 194 | 41971 | 43.58 | 4266 | 4171 | 867.5 |
| A | 0 | 226 | 41798 | 43.38 | 4266 | 4171 | 867.5 |
| B | 15 | 204 | 952230 | 1164.79 | 4282 | 4180 | 813.9 |
| B | 10 | 16 | 660495 | 806.36 | 4282 | 4180 | 813.9 |
| B | 15 | 255 | 491557 | 598.8 | 4282 | 4180 | 813.9 |
| C | 9 | 247 | 4805871 | 5140.32 | 4042 | 4061 | 934.1 |
| C | 1 | 16 | 514021 | 545.91 | 4042 | 4061 | 934.1 |
| C | 1 | 241 | 175513 | 183.54 | 4042 | 4061 | 934.1 |
| D | 2 | 152 | 682229 | 675.6 | 4117 | 3995 | 1003.9 |
| D | 2 | 33 | 536132 | 530.07 | 4117 | 3995 | 1003.9 |
| D | 8 | 195 | 441679 | 435.98 | 4117 | 3995 | 1003.9 |
Histogram calculated using DETX and DETY for each event in the final _common_clean file
| Quadrant A |  |
 |
Quadrant B |
|---|---|---|---|
| Quadrant D |  |
 |
Quadrant C |
| Plot type | Count rate plots | Images |
|---|---|---|
| Comparison with Poisson distribution Blue bars denote a histogram of data divided into 1 sec bins. Red curve is a Poisson curve with rate = median count rate of data. |
 |
 |
| Quadrant-wise count rates Data is divided into 100 sec bins |
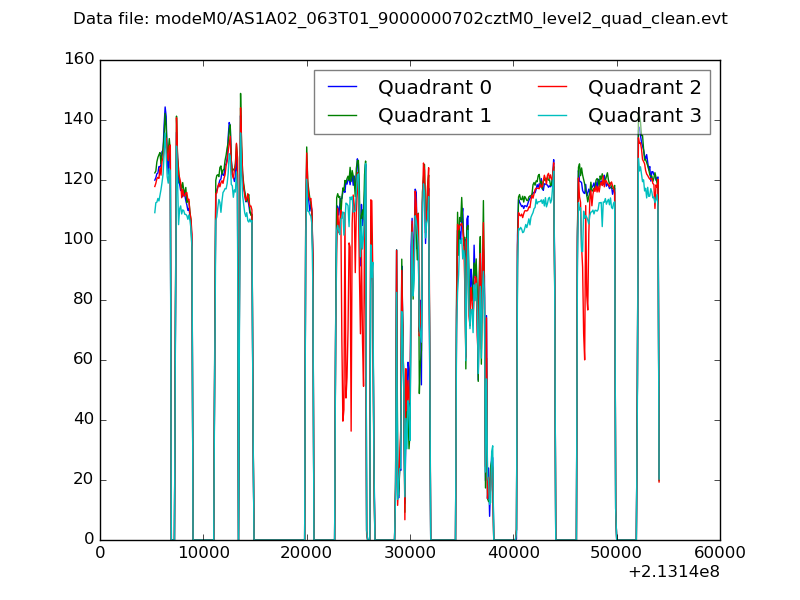 |
|
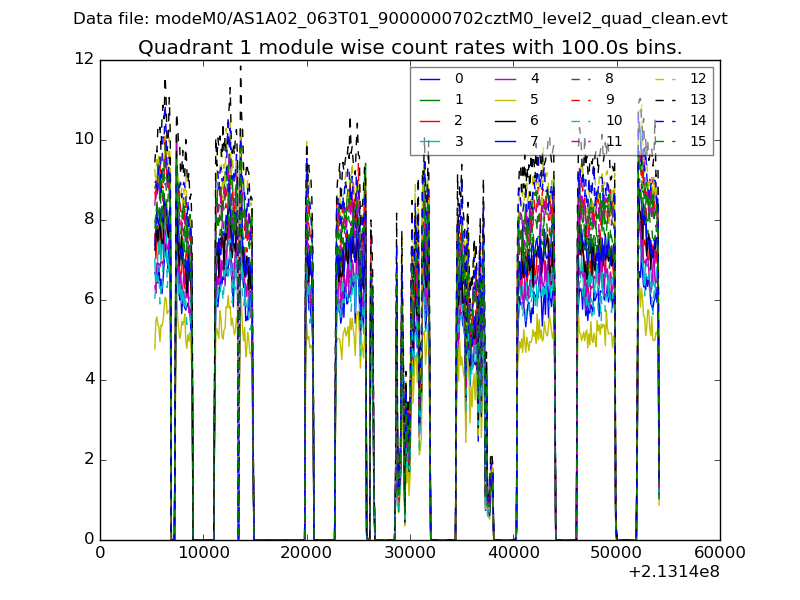
| Module-wise count rates for Quadrant A Data is divided into 100 sec bins |
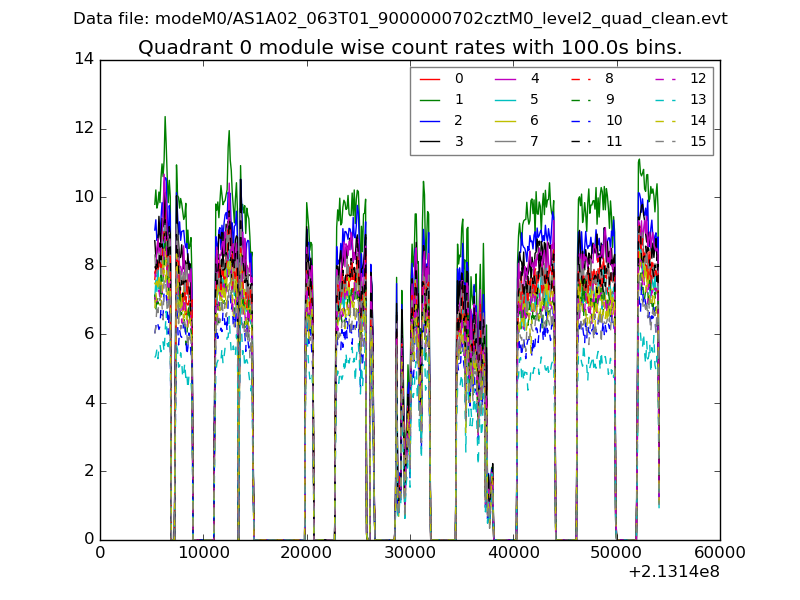 |
 |
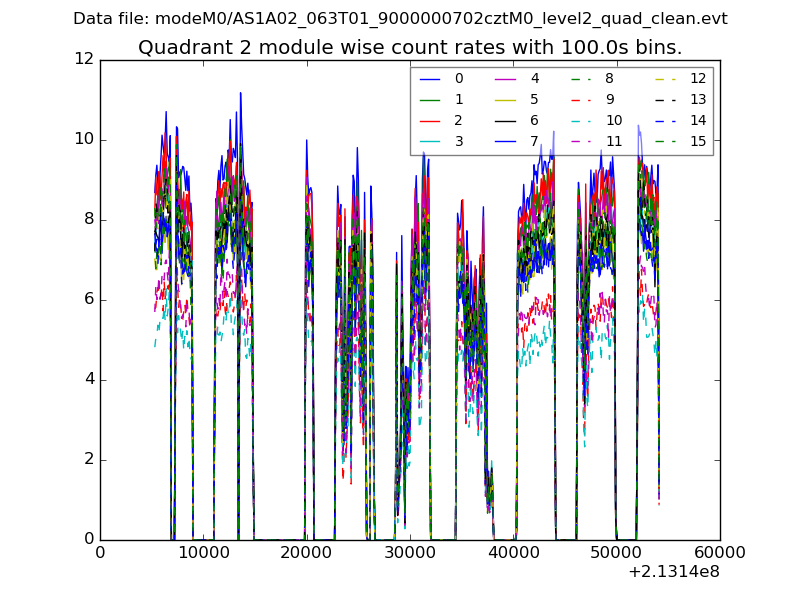
| Module-wise count rates for Quadrant B Data is divided into 100 sec bins |
 |
 |
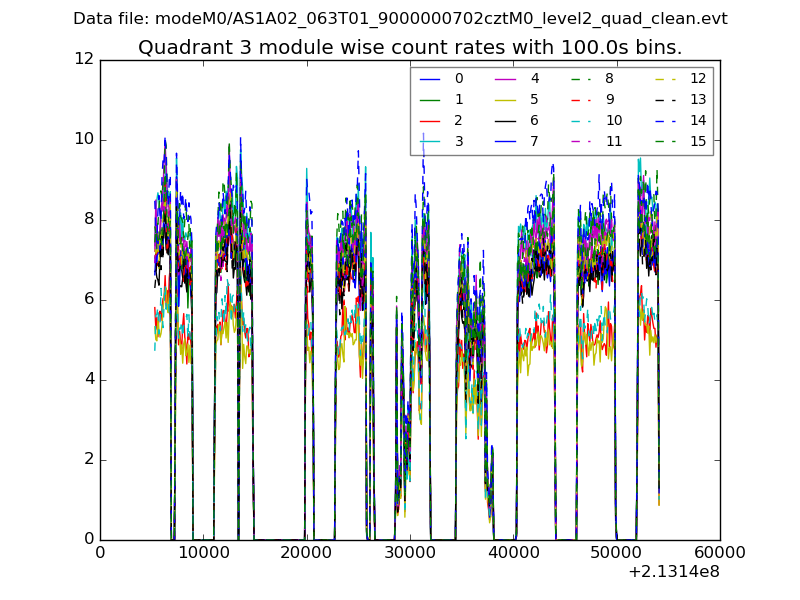
| Module-wise count rates for Quadrant C Data is divided into 100 sec bins |
 |
 |
| Module-wise count rates for Quadrant D Data is divided into 100 sec bins |
 |
 |
| Parameter | Plot |
|---|---|
| CZT HV Monitor |  |
| D_VDD |  |
| Temperature 1 |  |
| Veto HV Monitor |  |
| Veto LLD |  |
| Alpha Counter |  |
| _CPM_Rate |  |
| CZT Counter |  |
| +2.5 Volts monitor |  |
| +5 Volts monitor |  |
| _ROLL_ROT |  |
| _Roll_DEC |  |
| _Roll_RA |  |
| Veto Counter |  |