| Param | Original file | Final file |
|---|---|---|
| Filename | modeM0/AS1T01_138T01_9000000698cztM0_level2_bc.evt | modeM0/AS1T01_138T01_9000000698cztM0_level2_quad_clean.evt |
| Size (bytes) | 2,790,673,920 | 855,057,600 |
| Size | 2.6 GB | 815.4 MB |
| Events in quadrant A | 16,535,743 | 5,184,243 |
| Events in quadrant B | 21,188,535 | 5,176,193 |
| Events in quadrant C | 15,435,168 | 5,234,062 |
| Events in quadrant D | 25,976,662 | 4,890,938 |
| Mode M0 | |||
|---|---|---|---|
| Quadrant | BADHDUFLAG | Total packets | Discarded packets |
| A | 0 | 168321 | 0 |
| B | 0 | 179682 | 0 |
| C | 0 | 162399 | 0 |
| D | 0 | 198086 | 0 |
| Mode SS | |||
|---|---|---|---|
| Quadrant | BADHDUFLAG | Total packets | Discarded packets |
| A | 0 | 1606 | 0 |
| B | 0 | 1606 | 0 |
| C | 0 | 1606 | 0 |
| D | 0 | 1606 | 0 |
| Mode M9 | |||
|---|---|---|---|
| Quadrant | BADHDUFLAG | Total packets | Discarded packets |
| A | 0 | 116 | 0 |
| B | 0 | 116 | 0 |
| C | 0 | 116 | 0 |
| D | 0 | 116 | 0 |
| Quadrant | Total seconds | Saturated seconds | Saturation percentage |
|---|---|---|---|
| A | 78938 | 1261 | 1.597456% |
| B | 78943 | 1388 | 1.758231% |
| C | 78936 | 623 | 0.789247% |
| D | 78941 | 3297 | 4.176537% |
Noise dominated data is calculated using 1-second bins in cleaned event files. If a bin has >2000 counts, and if more than 50% of those come from <1% of pixels, then it is considered to be noise-dominated and hence unusable.
| Quadrant | # 1 sec bins | Bins with >0 counts | Bins with >2000 counts | High rate bins dominated by noise | Noise dominated (total time) | Noise dominated (detector-on time) | Marked lightcurve |
|---|---|---|---|---|---|---|---|
| A | 90478 | 78946 | 22 | 22 | 0.02% | 0.03% |  |
| B | 90478 | 78947 | 61 | 61 | 0.07% | 0.08% |  |
| C | 90478 | 78942 | 11 | 11 | 0.01% | 0.01% |  |
| D | 90478 | 78944 | 447 | 447 | 0.49% | 0.57% |  |
Top three noisy pixels from each quadrant. If the there are fewer than three noisy pixels in the level2.evt file, extra rows are filled as -1
| Pixel properties | Quadrant properties | ||||||
|---|---|---|---|---|---|---|---|
| Quadrant | DetID | PixID | Counts | Sigma | Mean | Median | Sigma |
| A | 15 | 174 | 836820 | 984.65 | 3780 | 3692 | 846.1 |
| A | 0 | 50 | 636037 | 747.35 | 3780 | 3692 | 846.1 |
| A | 0 | 247 | 314139 | 366.91 | 3780 | 3692 | 846.1 |
| B | 15 | 204 | 3561396 | 4786.94 | 3815 | 3697 | 743.2 |
| B | 10 | 16 | 1100156 | 1475.3 | 3815 | 3697 | 743.2 |
| B | 7 | 221 | 440409 | 587.6 | 3815 | 3697 | 743.2 |
| C | 9 | 247 | 642618 | 774.38 | 3717 | 3655 | 825.1 |
| C | 1 | 16 | 57999 | 65.86 | 3717 | 3655 | 825.1 |
| C | 1 | 241 | 43030 | 47.72 | 3717 | 3655 | 825.1 |
| D | 2 | 33 | 5381520 | 6208.21 | 3665 | 3515 | 866.3 |
| D | 8 | 195 | 1330415 | 1531.73 | 3665 | 3515 | 866.3 |
| D | 2 | 152 | 1210273 | 1393.05 | 3665 | 3515 | 866.3 |
Histogram calculated using DETX and DETY for each event in the final _common_clean file
| Quadrant A |  |
 |
Quadrant B |
|---|---|---|---|
| Quadrant D | 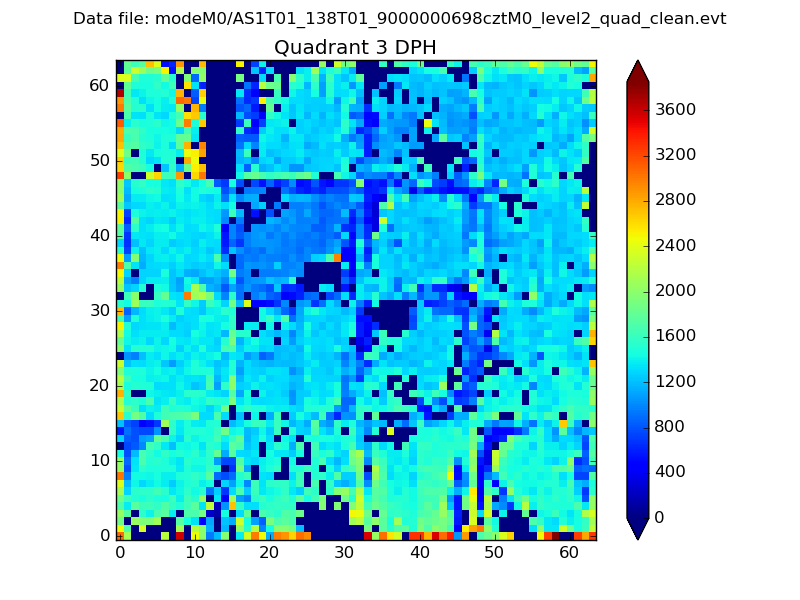 |
 |
Quadrant C |
| Plot type | Count rate plots | Images |
|---|---|---|
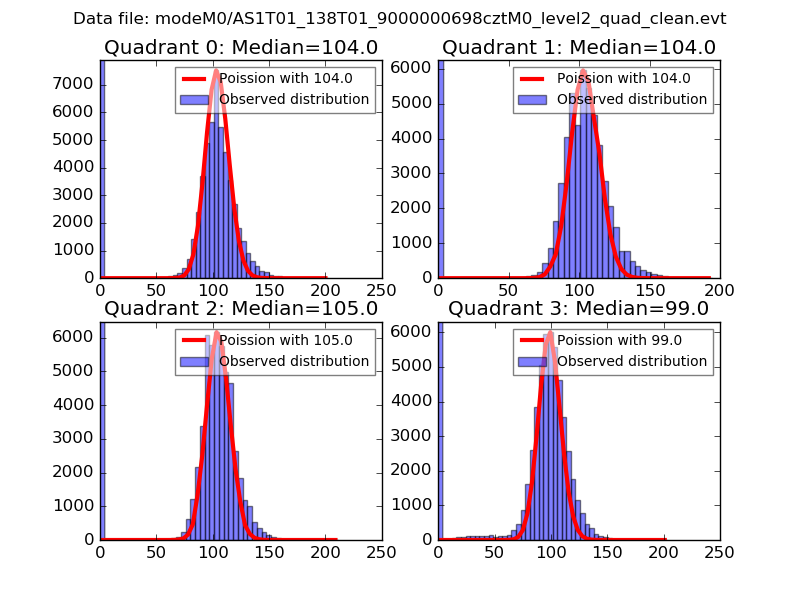
| Comparison with Poisson distribution Blue bars denote a histogram of data divided into 1 sec bins. Red curve is a Poisson curve with rate = median count rate of data. |
 |
 |
| Quadrant-wise count rates Data is divided into 100 sec bins |
 |
|
| Module-wise count rates for Quadrant A Data is divided into 100 sec bins |
 |
 |
| Module-wise count rates for Quadrant B Data is divided into 100 sec bins |
 |
 |
| Module-wise count rates for Quadrant C Data is divided into 100 sec bins |
 |
 |
| Module-wise count rates for Quadrant D Data is divided into 100 sec bins |
 |
 |
| Parameter | Plot |
|---|---|
| CZT HV Monitor |  |
| D_VDD |  |
| Temperature 1 |  |
| Veto HV Monitor |  |
| Veto LLD |  |
| Alpha Counter |  |
| _CPM_Rate | 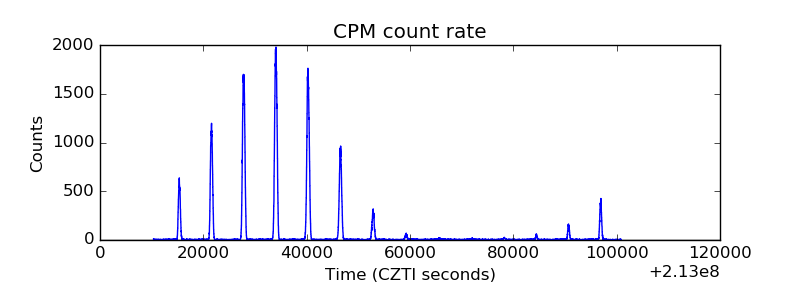 |
| CZT Counter |  |
| +2.5 Volts monitor |  |
| +5 Volts monitor |  |
| _ROLL_ROT |  |
| _Roll_DEC |  |
| _Roll_RA |  |
| Veto Counter |  |