| Param | Original file | Final file |
|---|---|---|
| Filename | modeM0/AS1G06_087T03_9000000696cztM0_level2.evt | modeM0/AS1G06_087T03_9000000696cztM0_level2_quad_clean.evt |
| Size (bytes) | 1,813,838,400 | 224,055,360 |
| Size | 1.7 GB | 213.7 MB |
| Events in quadrant A | 11,523,887 | 1,282,736 |
| Events in quadrant B | 12,788,061 | 1,292,195 |
| Events in quadrant C | 12,076,046 | 1,277,859 |
| Events in quadrant D | 16,854,885 | 1,213,809 |
| Mode SS | |||
|---|---|---|---|
| Quadrant | BADHDUFLAG | Total packets | Discarded packets |
| A | 0 | 507 | 0 |
| B | 0 | 510 | 0 |
| C | 0 | 498 | 0 |
| D | 0 | 514 | 0 |
| Mode M9 | |||
|---|---|---|---|
| Quadrant | BADHDUFLAG | Total packets | Discarded packets |
| A | 0 | 27 | 0 |
| B | 0 | 27 | 0 |
| C | 0 | 27 | 0 |
| D | 0 | 27 | 0 |
| Mode M0 | |||
|---|---|---|---|
| Quadrant | BADHDUFLAG | Total packets | Discarded packets |
| A | 0 | 52346 | 0 |
| B | 0 | 54824 | 0 |
| C | 0 | 53950 | 0 |
| D | 0 | 67220 | 0 |
| Quadrant | Total seconds | Saturated seconds | Saturation percentage |
|---|---|---|---|
| A | 25174 | 365 | 1.449909% |
| B | 25009 | 462 | 1.847335% |
| C | 25154 | 595 | 2.365429% |
| D | 24600 | 1286 | 5.227642% |
Noise dominated data is calculated using 1-second bins in cleaned event files. If a bin has >2000 counts, and if more than 50% of those come from <1% of pixels, then it is considered to be noise-dominated and hence unusable.
| Quadrant | # 1 sec bins | Bins with >0 counts | Bins with >2000 counts | High rate bins dominated by noise | Noise dominated (total time) | Noise dominated (detector-on time) | Marked lightcurve |
|---|---|---|---|---|---|---|---|
| A | 32609 | 26485 | 27 | 27 | 0.08% | 0.10% |  |
| B | 32609 | 26397 | 49 | 49 | 0.15% | 0.19% |  |
| C | 32609 | 26481 | 229 | 229 | 0.70% | 0.86% |  |
| D | 32609 | 26010 | 805 | 805 | 2.47% | 3.09% |  |
Top three noisy pixels from each quadrant. If the there are fewer than three noisy pixels in the level2.evt file, extra rows are filled as -1
| Pixel properties | Quadrant properties | ||||||
|---|---|---|---|---|---|---|---|
| Quadrant | DetID | PixID | Counts | Sigma | Mean | Median | Sigma |
| A | 0 | 50 | 185393 | 306.16 | 2918 | 2851 | 596.2 |
| A | 13 | 6 | 33497 | 51.4 | 2918 | 2851 | 596.2 |
| A | 0 | 226 | 30498 | 46.37 | 2918 | 2851 | 596.2 |
| B | 15 | 204 | 708020 | 1242.8 | 2937 | 2867 | 567.4 |
| B | 11 | 51 | 150232 | 259.72 | 2937 | 2867 | 567.4 |
| B | 10 | 16 | 145508 | 251.4 | 2937 | 2867 | 567.4 |
| C | 1 | 241 | 933807 | 1413.41 | 2831 | 2841 | 658.7 |
| C | 8 | 128 | 33741 | 46.91 | 2831 | 2841 | 658.7 |
| C | 13 | 61 | 22668 | 30.1 | 2831 | 2841 | 658.7 |
| D | 2 | 33 | 3785045 | 5623.27 | 2748 | 2663 | 672.6 |
| D | 4 | 95 | 606215 | 897.3 | 2748 | 2663 | 672.6 |
| D | 8 | 195 | 593432 | 878.3 | 2748 | 2663 | 672.6 |
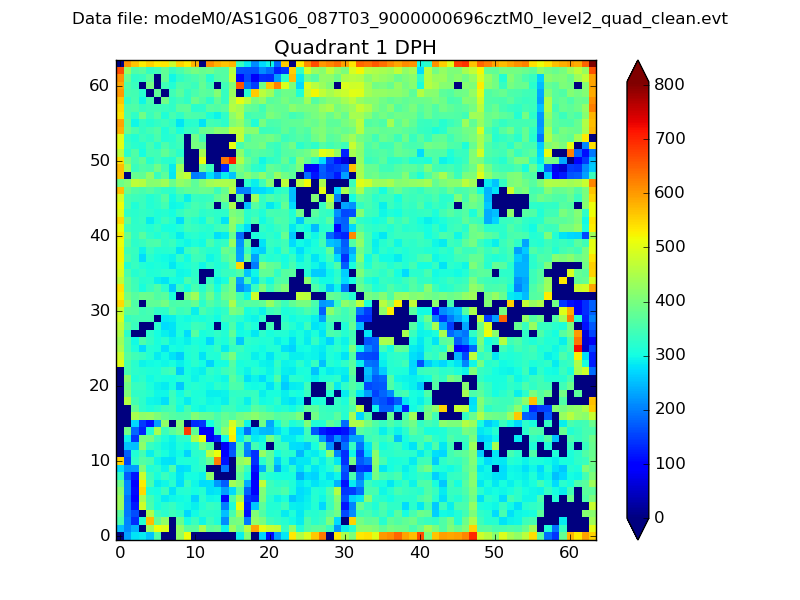
Histogram calculated using DETX and DETY for each event in the final _common_clean file
| Quadrant A |  |
 |
Quadrant B |
|---|---|---|---|
| Quadrant D | 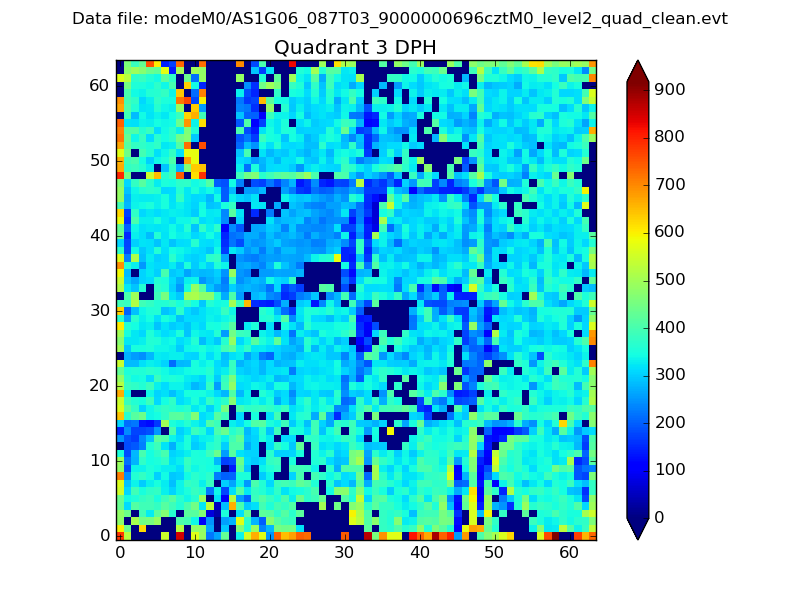 |
 |
Quadrant C |
| Plot type | Count rate plots | Images |
|---|---|---|
| Comparison with Poisson distribution Blue bars denote a histogram of data divided into 1 sec bins. Red curve is a Poisson curve with rate = median count rate of data. |
 |
 |
| Quadrant-wise count rates Data is divided into 100 sec bins |
 |
|
| Module-wise count rates for Quadrant A Data is divided into 100 sec bins |
 |
 |
| Module-wise count rates for Quadrant B Data is divided into 100 sec bins |
 |
 |
| Module-wise count rates for Quadrant C Data is divided into 100 sec bins |
 |
 |
| Module-wise count rates for Quadrant D Data is divided into 100 sec bins |
 |
 |
| Parameter | Plot |
|---|---|
| CZT HV Monitor |  |
| D_VDD |  |
| Temperature 1 | 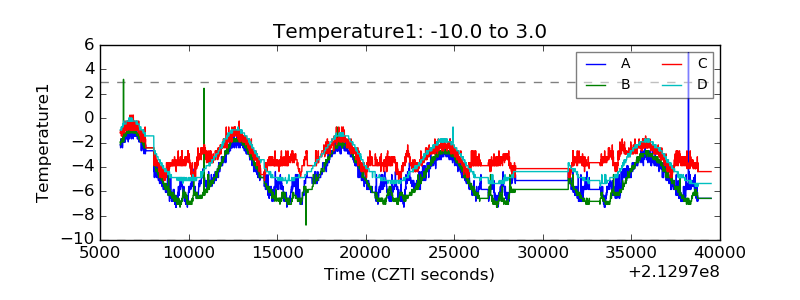 |
| Veto HV Monitor |  |
| Veto LLD | 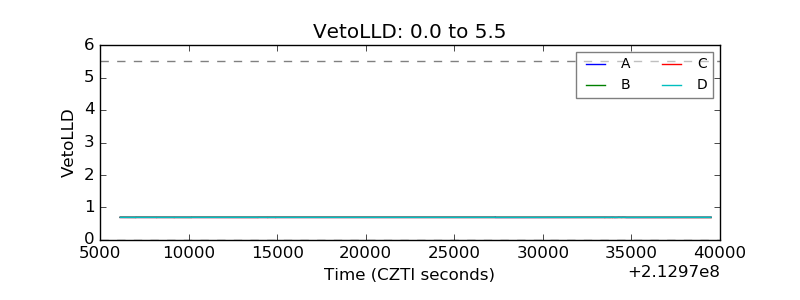 |
| Alpha Counter |  |
| _CPM_Rate |  |
| CZT Counter |  |
| +2.5 Volts monitor |  |
| +5 Volts monitor |  |
| _ROLL_ROT | 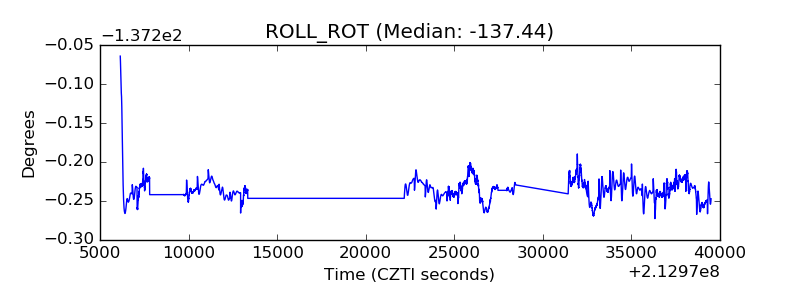 |
| _Roll_DEC |  |
| _Roll_RA |  |
| Veto Counter | 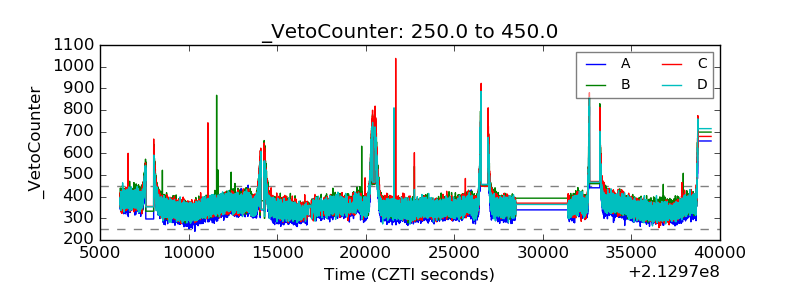 |