| Param | Original file | Final file |
|---|---|---|
| Filename | modeM0/AS1T01_137T01_9000000694cztM0_level2_bc.evt | modeM0/AS1T01_137T01_9000000694cztM0_level2_quad_clean.evt |
| Size (bytes) | 120,467,520 | 23,713,920 |
| Size | 114.9 MB | 22.6 MB |
| Events in quadrant A | 574,543 | 127,011 |
| Events in quadrant B | 717,181 | 125,876 |
| Events in quadrant C | 780,703 | 121,281 |
| Events in quadrant D | 1,347,972 | 114,123 |
| Mode M0 | |||
|---|---|---|---|
| Quadrant | BADHDUFLAG | Total packets | Discarded packets |
| A | 0 | 6514 | 0 |
| B | 0 | 6781 | 0 |
| C | 0 | 7316 | 0 |
| D | 0 | 8760 | 0 |
| Mode SS | |||
|---|---|---|---|
| Quadrant | BADHDUFLAG | Total packets | Discarded packets |
| A | 0 | 68 | 0 |
| B | 0 | 68 | 0 |
| C | 0 | 66 | 0 |
| D | 0 | 66 | 0 |
| Quadrant | Total seconds | Saturated seconds | Saturation percentage |
|---|---|---|---|
| A | 3238 | 1 | 0.030883% |
| B | 3224 | 15 | 0.465261% |
| C | 3212 | 118 | 3.673724% |
| D | 3195 | 75 | 2.347418% |
Noise dominated data is calculated using 1-second bins in cleaned event files. If a bin has >2000 counts, and if more than 50% of those come from <1% of pixels, then it is considered to be noise-dominated and hence unusable.
| Quadrant | # 1 sec bins | Bins with >0 counts | Bins with >2000 counts | High rate bins dominated by noise | Noise dominated (total time) | Noise dominated (detector-on time) | Marked lightcurve |
|---|---|---|---|---|---|---|---|
| A | 3305 | 3299 | 1 | 1 | 0.03% | 0.03% |  |
| B | 3305 | 3295 | 3 | 3 | 0.09% | 0.09% |  |
| C | 3305 | 3294 | 43 | 43 | 1.30% | 1.31% |  |
| D | 3305 | 3285 | 19 | 19 | 0.57% | 0.58% | 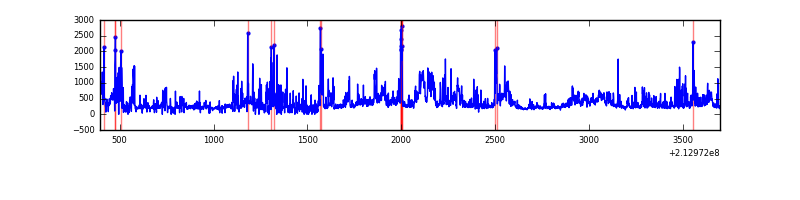 |
Top three noisy pixels from each quadrant. If the there are fewer than three noisy pixels in the level2.evt file, extra rows are filled as -1
| Pixel properties | Quadrant properties | ||||||
|---|---|---|---|---|---|---|---|
| Quadrant | DetID | PixID | Counts | Sigma | Mean | Median | Sigma |
| A | 0 | 50 | 10791 | 306.21 | 144 | 140 | 34.8 |
| A | 0 | 247 | 4240 | 117.87 | 144 | 140 | 34.8 |
| A | 15 | 174 | 2322 | 62.73 | 144 | 140 | 34.8 |
| B | 15 | 204 | 80570 | 2639.38 | 144 | 140 | 30.5 |
| B | 4 | 48 | 32740 | 1069.8 | 144 | 140 | 30.5 |
| B | 11 | 51 | 18491 | 602.2 | 144 | 140 | 30.5 |
| C | 1 | 241 | 241123 | 7478.72 | 136 | 133 | 32.2 |
| C | 14 | 67 | 3034 | 90.03 | 136 | 133 | 32.2 |
| C | 9 | 247 | 1821 | 52.38 | 136 | 133 | 32.2 |
| D | 2 | 33 | 522292 | 14840.05 | 138 | 131 | 35.2 |
| D | 11 | 192 | 95066 | 2698.1 | 138 | 131 | 35.2 |
| D | 8 | 195 | 73891 | 2096.29 | 138 | 131 | 35.2 |
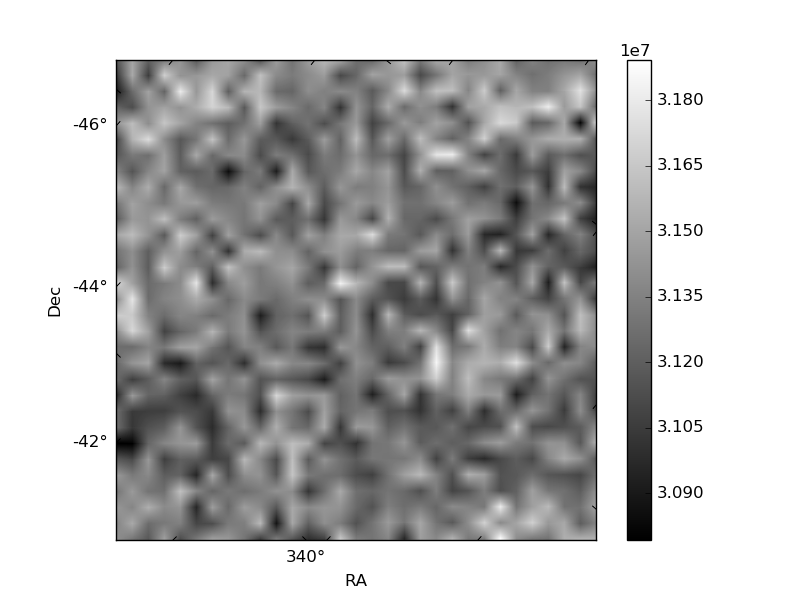
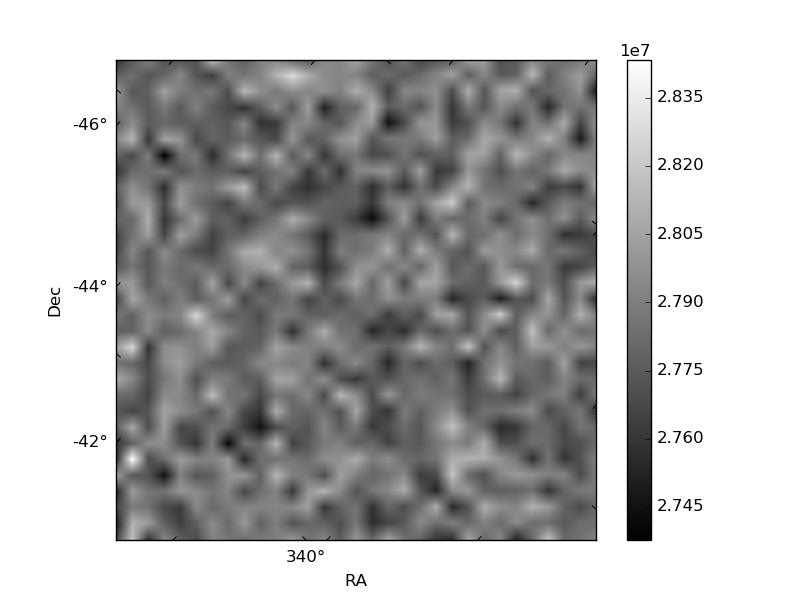
Histogram calculated using DETX and DETY for each event in the final _common_clean file
| Quadrant A |  |
 |
Quadrant B |
|---|---|---|---|
| Quadrant D |  |
 |
Quadrant C |
| Plot type | Count rate plots | Images |
|---|---|---|
| Comparison with Poisson distribution Blue bars denote a histogram of data divided into 1 sec bins. Red curve is a Poisson curve with rate = median count rate of data. |
 |
 |
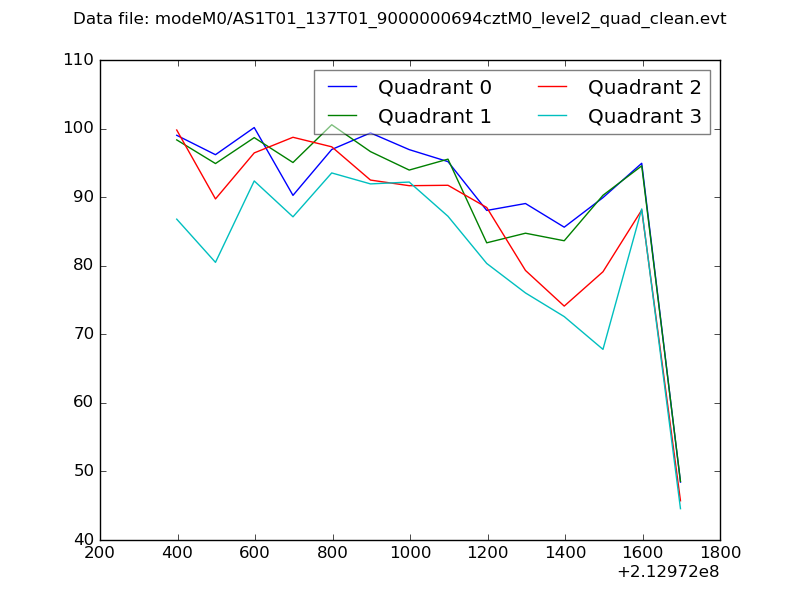
| Quadrant-wise count rates Data is divided into 100 sec bins |
 |
|
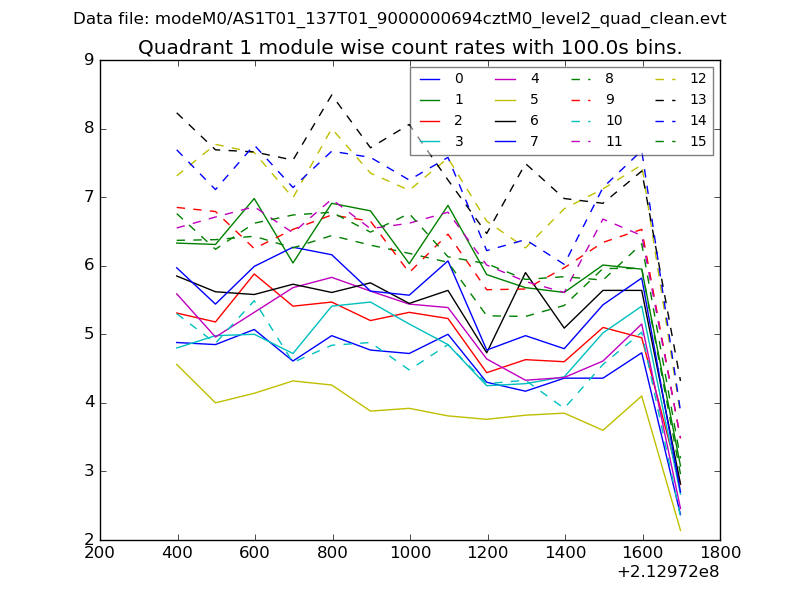
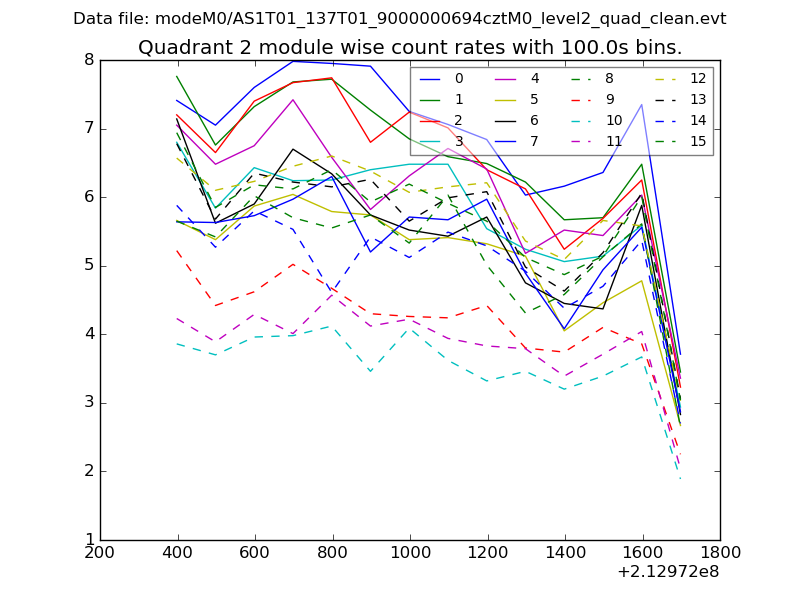
| Module-wise count rates for Quadrant A Data is divided into 100 sec bins |
 |
 |
| Module-wise count rates for Quadrant B Data is divided into 100 sec bins |
 |
 |
| Module-wise count rates for Quadrant C Data is divided into 100 sec bins |
 |
 |
| Module-wise count rates for Quadrant D Data is divided into 100 sec bins |
 |
 |
| Parameter | Plot |
|---|---|
| CZT HV Monitor | 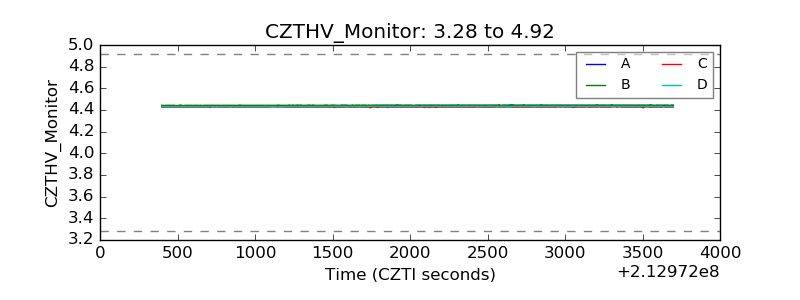 |
| D_VDD |  |
| Temperature 1 |  |
| Veto HV Monitor |  |
| Veto LLD | 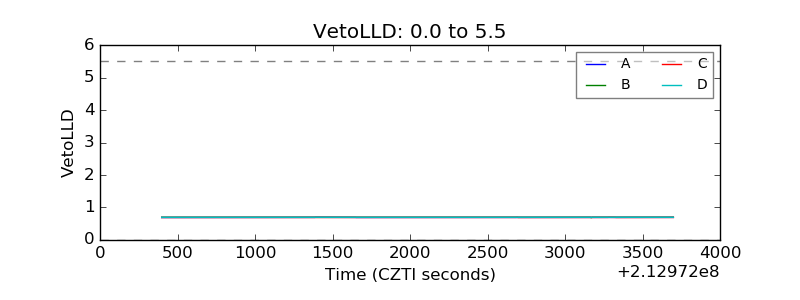 |
| Alpha Counter |  |
| _CPM_Rate |  |
| CZT Counter | 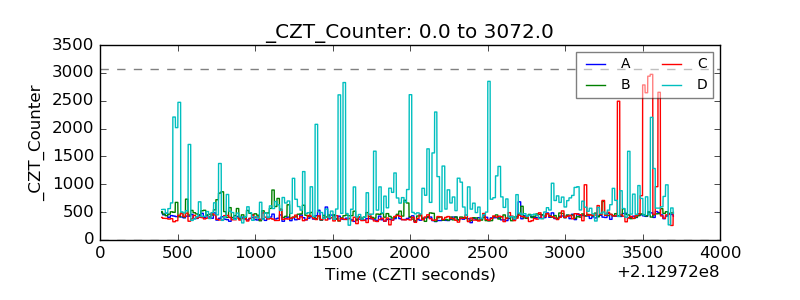 |
| +2.5 Volts monitor |  |
| +5 Volts monitor |  |
| _ROLL_ROT |  |
| _Roll_DEC |  |
| _Roll_RA |  |
| Veto Counter |  |