| Param | Original file | Final file |
|---|---|---|
| Filename | modeM0/AS1G05_187T01_9000000690cztM0_level2_bc.evt | modeM0/AS1G05_187T01_9000000690cztM0_level2_quad_clean.evt |
| Size (bytes) | 200,010,240 | 49,809,600 |
| Size | 190.7 MB | 47.5 MB |
| Events in quadrant A | 1,018,615 | 292,683 |
| Events in quadrant B | 1,357,929 | 294,554 |
| Events in quadrant C | 1,478,162 | 291,280 |
| Events in quadrant D | 1,851,575 | 275,935 |
| Mode SS | |||
|---|---|---|---|
| Quadrant | BADHDUFLAG | Total packets | Discarded packets |
| A | 0 | 102 | 0 |
| B | 0 | 102 | 0 |
| C | 0 | 102 | 0 |
| D | 0 | 102 | 0 |
| Mode M9 | |||
|---|---|---|---|
| Quadrant | BADHDUFLAG | Total packets | Discarded packets |
| A | 0 | 13 | 0 |
| B | 0 | 13 | 0 |
| C | 0 | 13 | 0 |
| D | 0 | 13 | 0 |
| Mode M0 | |||
|---|---|---|---|
| Quadrant | BADHDUFLAG | Total packets | Discarded packets |
| A | 0 | 10506 | 0 |
| B | 0 | 11654 | 0 |
| C | 0 | 11858 | 0 |
| D | 0 | 12845 | 0 |
| Quadrant | Total seconds | Saturated seconds | Saturation percentage |
|---|---|---|---|
| A | 5045 | 79 | 1.565907% |
| B | 5045 | 103 | 2.041625% |
| C | 5045 | 146 | 2.893954% |
| D | 5045 | 126 | 2.497522% |
Noise dominated data is calculated using 1-second bins in cleaned event files. If a bin has >2000 counts, and if more than 50% of those come from <1% of pixels, then it is considered to be noise-dominated and hence unusable.
| Quadrant | # 1 sec bins | Bins with >0 counts | Bins with >2000 counts | High rate bins dominated by noise | Noise dominated (total time) | Noise dominated (detector-on time) | Marked lightcurve |
|---|---|---|---|---|---|---|---|
| A | 6330 | 5045 | 0 | 0 | 0.00% | 0.00% |  |
| B | 6330 | 5045 | 0 | 0 | 0.00% | 0.00% |  |
| C | 6330 | 5045 | 64 | 64 | 1.01% | 1.27% |  |
| D | 6330 | 5045 | 47 | 47 | 0.74% | 0.93% |  |
Top three noisy pixels from each quadrant. If the there are fewer than three noisy pixels in the level2.evt file, extra rows are filled as -1
| Pixel properties | Quadrant properties | ||||||
|---|---|---|---|---|---|---|---|
| Quadrant | DetID | PixID | Counts | Sigma | Mean | Median | Sigma |
| A | 0 | 50 | 16457 | 277.24 | 255 | 248 | 58.5 |
| A | 13 | 6 | 9912 | 165.3 | 255 | 248 | 58.5 |
| A | 13 | 251 | 9066 | 150.83 | 255 | 248 | 58.5 |
| B | 15 | 204 | 279350 | 5505.33 | 259 | 252 | 50.7 |
| B | 4 | 48 | 30474 | 596.14 | 259 | 252 | 50.7 |
| B | 11 | 51 | 19655 | 382.73 | 259 | 252 | 50.7 |
| C | 9 | 247 | 492698 | 8613.6 | 250 | 246 | 57.2 |
| C | 14 | 67 | 2445 | 38.46 | 250 | 246 | 57.2 |
| C | 1 | 16 | 1707 | 25.55 | 250 | 246 | 57.2 |
| D | 2 | 33 | 677960 | 11314.68 | 250 | 241 | 59.9 |
| D | 11 | 192 | 50093 | 832.29 | 250 | 241 | 59.9 |
| D | 8 | 195 | 46085 | 765.38 | 250 | 241 | 59.9 |
Histogram calculated using DETX and DETY for each event in the final _common_clean file
| Quadrant A |  |
 |
Quadrant B |
|---|---|---|---|
| Quadrant D |  |
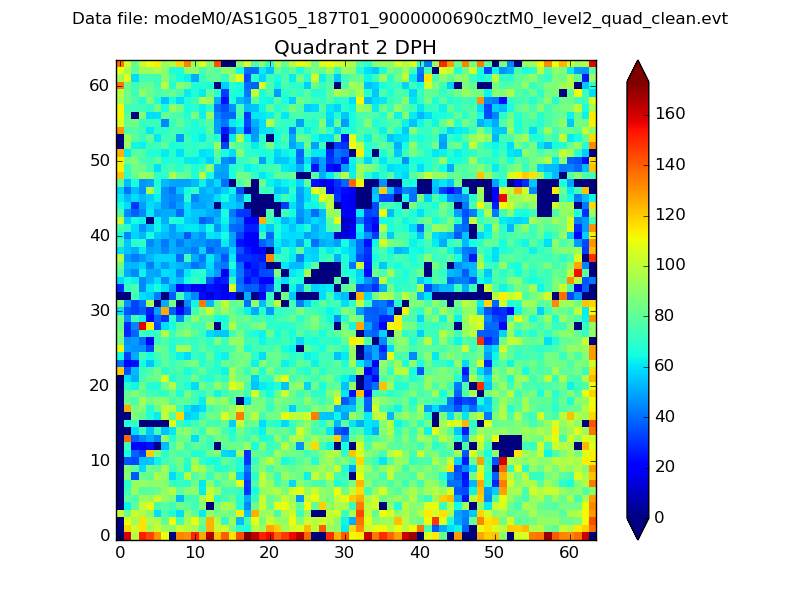 |
Quadrant C |
| Plot type | Count rate plots | Images |
|---|---|---|
| Comparison with Poisson distribution Blue bars denote a histogram of data divided into 1 sec bins. Red curve is a Poisson curve with rate = median count rate of data. |
 |
 |
| Quadrant-wise count rates Data is divided into 100 sec bins |
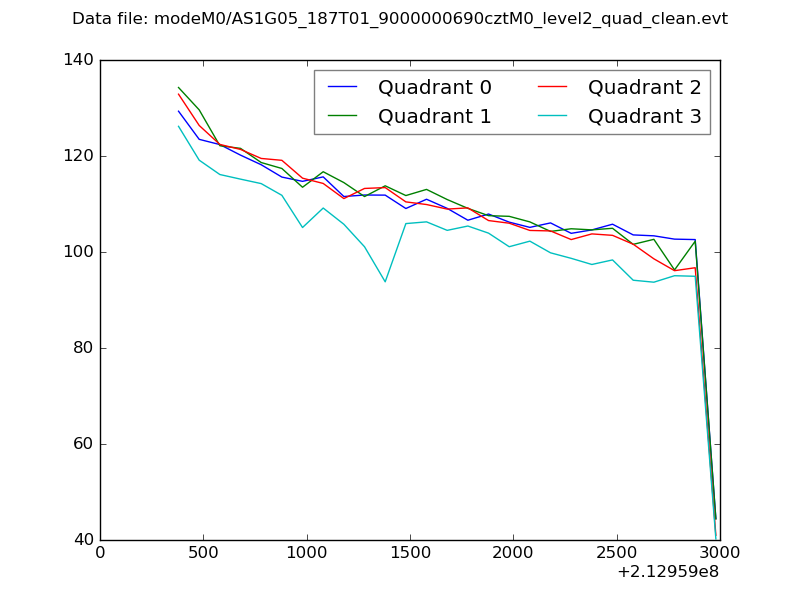 |
|
| Module-wise count rates for Quadrant A Data is divided into 100 sec bins |
 |
 |
| Module-wise count rates for Quadrant B Data is divided into 100 sec bins |
 |
 |
| Module-wise count rates for Quadrant C Data is divided into 100 sec bins |
 |
 |
| Module-wise count rates for Quadrant D Data is divided into 100 sec bins |
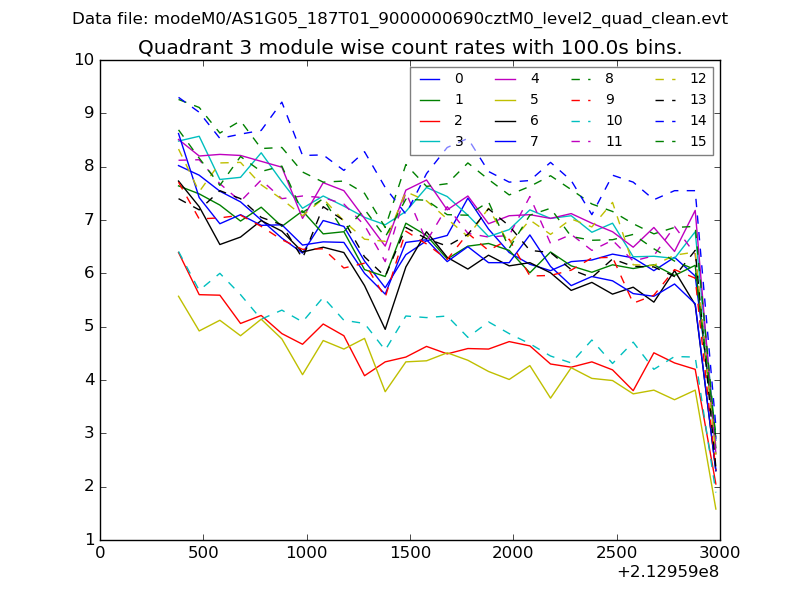 |
 |
| Parameter | Plot |
|---|---|
| CZT HV Monitor |  |
| D_VDD |  |
| Temperature 1 |  |
| Veto HV Monitor |  |
| Veto LLD |  |
| Alpha Counter |  |
| _CPM_Rate |  |
| CZT Counter |  |
| +2.5 Volts monitor |  |
| +5 Volts monitor |  |
| _ROLL_ROT |  |
| _Roll_DEC |  |
| _Roll_RA |  |
| Veto Counter |  |