| Param | Original file | Final file |
|---|---|---|
| Filename | modeM0/AS1G05_178T01_9000000692cztM0_level2_bc.evt | modeM0/AS1G05_178T01_9000000692cztM0_level2_quad_clean.evt |
| Size (bytes) | 213,632,640 | 76,006,080 |
| Size | 203.7 MB | 72.5 MB |
| Events in quadrant A | 1,194,118 | 484,227 |
| Events in quadrant B | 1,552,825 | 484,691 |
| Events in quadrant C | 1,129,545 | 477,847 |
| Events in quadrant D | 2,196,071 | 455,352 |
| Mode SS | |||
|---|---|---|---|
| Quadrant | BADHDUFLAG | Total packets | Discarded packets |
| A | 0 | 116 | 0 |
| B | 0 | 120 | 0 |
| C | 0 | 114 | 0 |
| D | 0 | 118 | 0 |
| Mode M9 | |||
|---|---|---|---|
| Quadrant | BADHDUFLAG | Total packets | Discarded packets |
| A | 0 | 13 | 0 |
| B | 0 | 13 | 0 |
| C | 0 | 13 | 0 |
| D | 0 | 13 | 0 |
| Mode M0 | |||
|---|---|---|---|
| Quadrant | BADHDUFLAG | Total packets | Discarded packets |
| A | 0 | 12253 | 0 |
| B | 0 | 13541 | 0 |
| C | 0 | 11955 | 0 |
| D | 0 | 15644 | 0 |
| Quadrant | Total seconds | Saturated seconds | Saturation percentage |
|---|---|---|---|
| A | 5728 | 78 | 1.361732% |
| B | 5706 | 175 | 3.066947% |
| C | 5724 | 48 | 0.838574% |
| D | 5709 | 222 | 3.888597% |
Noise dominated data is calculated using 1-second bins in cleaned event files. If a bin has >2000 counts, and if more than 50% of those come from <1% of pixels, then it is considered to be noise-dominated and hence unusable.
| Quadrant | # 1 sec bins | Bins with >0 counts | Bins with >2000 counts | High rate bins dominated by noise | Noise dominated (total time) | Noise dominated (detector-on time) | Marked lightcurve |
|---|---|---|---|---|---|---|---|
| A | 7032 | 5825 | 0 | 0 | 0.00% | 0.00% |  |
| B | 7032 | 5820 | 0 | 0 | 0.00% | 0.00% | 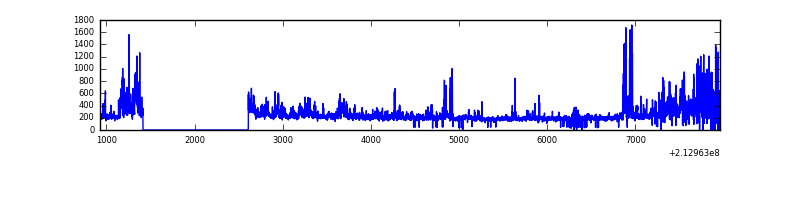 |
| C | 7032 | 5826 | 0 | 0 | 0.00% | 0.00% |  |
| D | 7032 | 5825 | 31 | 31 | 0.44% | 0.53% |  |
Top three noisy pixels from each quadrant. If the there are fewer than three noisy pixels in the level2.evt file, extra rows are filled as -1
| Pixel properties | Quadrant properties | ||||||
|---|---|---|---|---|---|---|---|
| Quadrant | DetID | PixID | Counts | Sigma | Mean | Median | Sigma |
| A | 13 | 251 | 62729 | 951.83 | 283 | 275 | 65.6 |
| A | 0 | 50 | 23587 | 355.29 | 283 | 275 | 65.6 |
| A | 13 | 6 | 9150 | 135.26 | 283 | 275 | 65.6 |
| B | 15 | 204 | 228643 | 3960.38 | 282 | 273 | 57.7 |
| B | 4 | 48 | 71076 | 1227.86 | 282 | 273 | 57.7 |
| B | 10 | 16 | 55789 | 962.76 | 282 | 273 | 57.7 |
| C | 14 | 67 | 18611 | 286.27 | 279 | 274 | 64.1 |
| C | 9 | 247 | 6976 | 104.63 | 279 | 274 | 64.1 |
| C | 12 | 4 | 4620 | 67.85 | 279 | 274 | 64.1 |
| D | 2 | 33 | 702540 | 10409.62 | 276 | 263 | 67.5 |
| D | 2 | 136 | 144741 | 2141.55 | 276 | 263 | 67.5 |
| D | 12 | 110 | 67318 | 993.93 | 276 | 263 | 67.5 |
Histogram calculated using DETX and DETY for each event in the final _common_clean file
| Quadrant A | 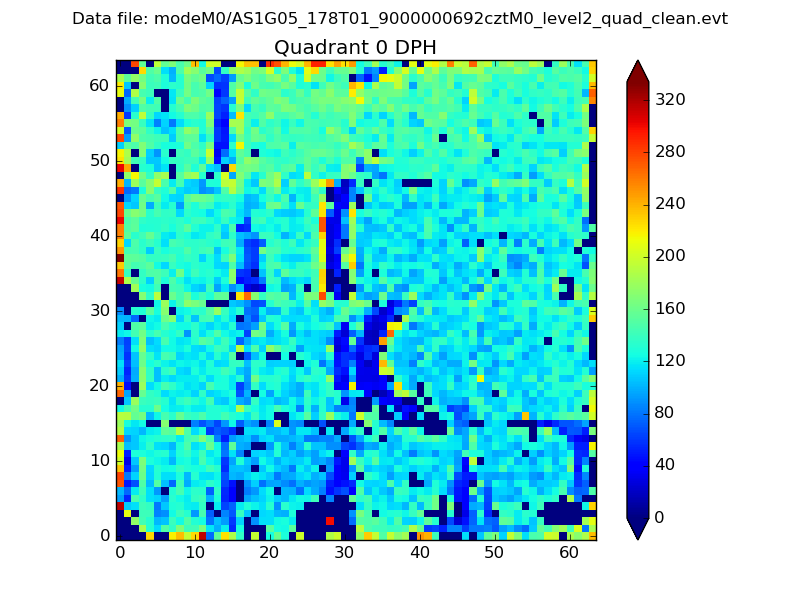 |
 |
Quadrant B |
|---|---|---|---|
| Quadrant D |  |
 |
Quadrant C |
| Plot type | Count rate plots | Images |
|---|---|---|
| Comparison with Poisson distribution Blue bars denote a histogram of data divided into 1 sec bins. Red curve is a Poisson curve with rate = median count rate of data. |
 |
 |
| Quadrant-wise count rates Data is divided into 100 sec bins |
 |
|
| Module-wise count rates for Quadrant A Data is divided into 100 sec bins |
 |
 |
| Module-wise count rates for Quadrant B Data is divided into 100 sec bins |
 |
 |
| Module-wise count rates for Quadrant C Data is divided into 100 sec bins |
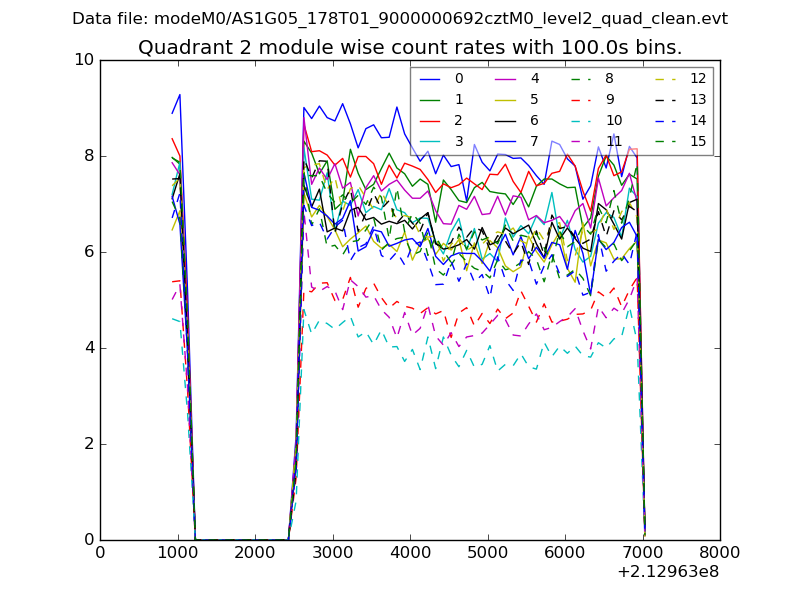 |
 |
| Module-wise count rates for Quadrant D Data is divided into 100 sec bins |
 |
 |
| Parameter | Plot |
|---|---|
| CZT HV Monitor | 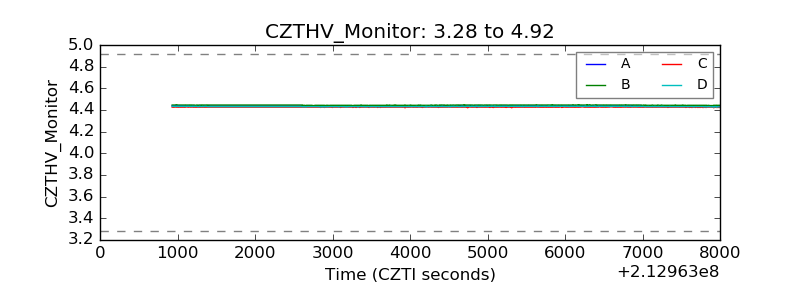 |
| D_VDD |  |
| Temperature 1 |  |
| Veto HV Monitor |  |
| Veto LLD |  |
| Alpha Counter | 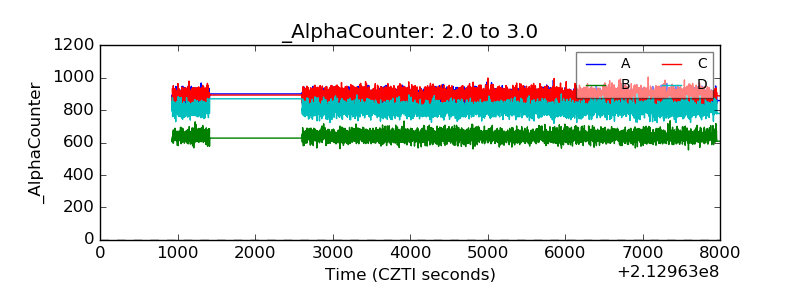 |
| _CPM_Rate |  |
| CZT Counter | 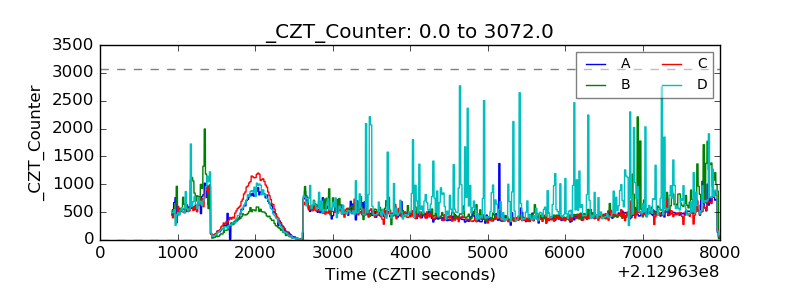 |
| +2.5 Volts monitor |  |
| +5 Volts monitor |  |
| _ROLL_ROT |  |
| _Roll_DEC |  |
| _Roll_RA |  |
| Veto Counter | 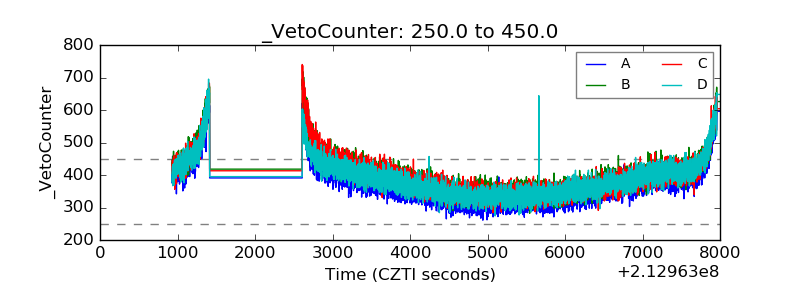 |