| Param | Original file | Final file |
|---|---|---|
| Filename | modeM0/AS1G05_204T01_9000000688cztM0_level2.evt | modeM0/AS1G05_204T01_9000000688cztM0_level2_quad_clean.evt |
| Size (bytes) | 3,976,776,000 | 1,003,602,240 |
| Size | 3.7 GB | 957.1 MB |
| Events in quadrant A | 24,588,274 | 6,728,433 |
| Events in quadrant B | 30,661,317 | 6,769,747 |
| Events in quadrant C | 24,670,556 | 6,842,003 |
| Events in quadrant D | 36,874,025 | 6,354,573 |
| Mode SS | |||
|---|---|---|---|
| Quadrant | BADHDUFLAG | Total packets | Discarded packets |
| A | 0 | 1102 | 0 |
| B | 0 | 1106 | 0 |
| C | 0 | 1102 | 0 |
| D | 0 | 1104 | 0 |
| Mode M0 | |||
|---|---|---|---|
| Quadrant | BADHDUFLAG | Total packets | Discarded packets |
| A | 0 | 112452 | 0 |
| B | 0 | 129258 | 0 |
| C | 0 | 112501 | 0 |
| D | 0 | 147297 | 0 |
| Mode M9 | |||
|---|---|---|---|
| Quadrant | BADHDUFLAG | Total packets | Discarded packets |
| A | 0 | 106 | 0 |
| B | 0 | 106 | 0 |
| C | 0 | 106 | 0 |
| D | 0 | 106 | 0 |
| Quadrant | Total seconds | Saturated seconds | Saturation percentage |
|---|---|---|---|
| A | 54044 | 493 | 0.912220% |
| B | 54015 | 901 | 1.668055% |
| C | 54019 | 416 | 0.770099% |
| D | 53992 | 2890 | 5.352645% |
Noise dominated data is calculated using 1-second bins in cleaned event files. If a bin has >2000 counts, and if more than 50% of those come from <1% of pixels, then it is considered to be noise-dominated and hence unusable.
| Quadrant | # 1 sec bins | Bins with >0 counts | Bins with >2000 counts | High rate bins dominated by noise | Noise dominated (total time) | Noise dominated (detector-on time) | Marked lightcurve |
|---|---|---|---|---|---|---|---|
| A | 107828 | 54125 | 37 | 37 | 0.03% | 0.07% |  |
| B | 107828 | 54123 | 129 | 129 | 0.12% | 0.24% | 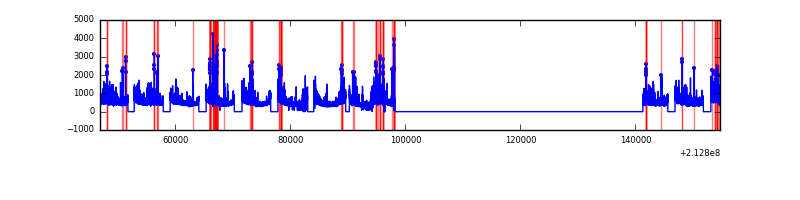 |
| C | 107828 | 54126 | 33 | 33 | 0.03% | 0.06% |  |
| D | 107828 | 54120 | 2200 | 2200 | 2.04% | 4.07% | 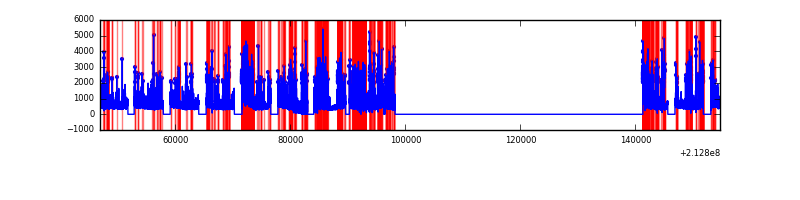 |
Top three noisy pixels from each quadrant. If the there are fewer than three noisy pixels in the level2.evt file, extra rows are filled as -1
| Pixel properties | Quadrant properties | ||||||
|---|---|---|---|---|---|---|---|
| Quadrant | DetID | PixID | Counts | Sigma | Mean | Median | Sigma |
| A | 0 | 50 | 445531 | 354.62 | 6207 | 6076 | 1239.2 |
| A | 13 | 6 | 115815 | 88.55 | 6207 | 6076 | 1239.2 |
| A | 15 | 174 | 89766 | 67.53 | 6207 | 6076 | 1239.2 |
| B | 15 | 204 | 4399222 | 3774.61 | 6270 | 6122 | 1163.9 |
| B | 11 | 51 | 444767 | 376.89 | 6270 | 6122 | 1163.9 |
| B | 0 | 219 | 437305 | 370.48 | 6270 | 6122 | 1163.9 |
| C | 9 | 247 | 455327 | 323.78 | 6112 | 6144 | 1387.3 |
| C | 14 | 67 | 223882 | 156.95 | 6112 | 6144 | 1387.3 |
| C | 1 | 16 | 101569 | 68.78 | 6112 | 6144 | 1387.3 |
| D | 2 | 33 | 8132290 | 5642.24 | 5976 | 5794 | 1440.3 |
| D | 2 | 152 | 2524868 | 1749.0 | 5976 | 5794 | 1440.3 |
| D | 2 | 63 | 1241790 | 858.15 | 5976 | 5794 | 1440.3 |
Histogram calculated using DETX and DETY for each event in the final _common_clean file
| Quadrant A |  |
 |
Quadrant B |
|---|---|---|---|
| Quadrant D |  |
 |
Quadrant C |
| Plot type | Count rate plots | Images |
|---|---|---|
| Comparison with Poisson distribution Blue bars denote a histogram of data divided into 1 sec bins. Red curve is a Poisson curve with rate = median count rate of data. |
 |
 |
| Quadrant-wise count rates Data is divided into 100 sec bins |
 |
|
| Module-wise count rates for Quadrant A Data is divided into 100 sec bins |
 |
 |
| Module-wise count rates for Quadrant B Data is divided into 100 sec bins |
 |
 |
| Module-wise count rates for Quadrant C Data is divided into 100 sec bins |
 |
 |
| Module-wise count rates for Quadrant D Data is divided into 100 sec bins |
 |
 |
| Parameter | Plot |
|---|---|
| CZT HV Monitor | 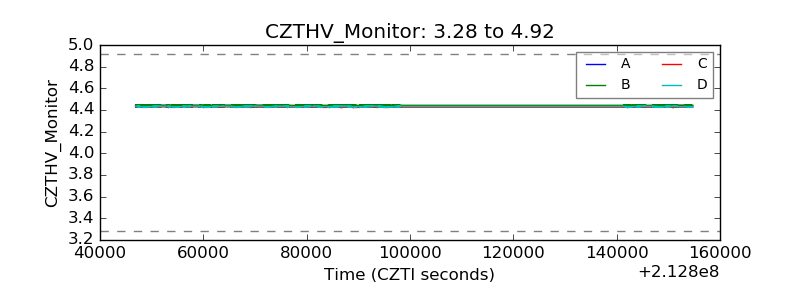 |
| D_VDD |  |
| Temperature 1 |  |
| Veto HV Monitor |  |
| Veto LLD | 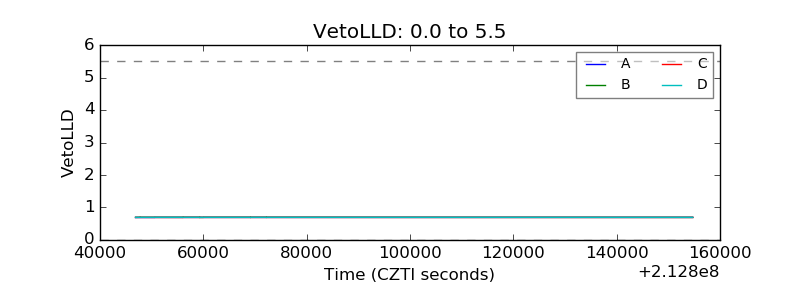 |
| Alpha Counter |  |
| _CPM_Rate |  |
| CZT Counter |  |
| +2.5 Volts monitor | 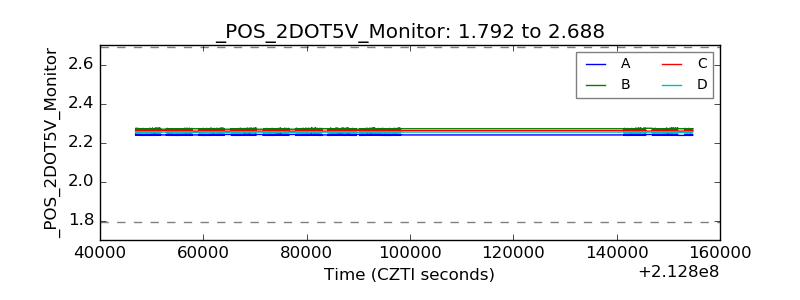 |
| +5 Volts monitor |  |
| _ROLL_ROT | 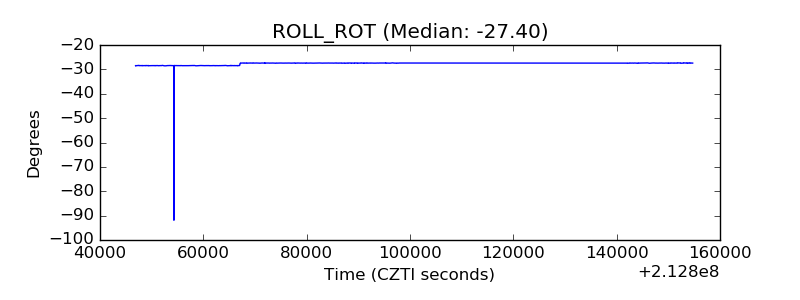 |
| _Roll_DEC |  |
| _Roll_RA |  |
| Veto Counter |  |