| Param | Original file | Final file |
|---|---|---|
| Filename | modeM0/AS1G05_132T01_9000000686cztM0_level2.evt | modeM0/AS1G05_132T01_9000000686cztM0_level2_quad_clean.evt |
| Size (bytes) | 6,203,105,280 | 1,086,494,400 |
| Size | 5.8 GB | 1.0 GB |
| Events in quadrant A | 42,905,011 | 6,726,126 |
| Events in quadrant B | 45,420,716 | 6,797,133 |
| Events in quadrant C | 40,546,664 | 6,793,735 |
| Events in quadrant D | 52,830,712 | 6,337,006 |
| Mode M0 | |||
|---|---|---|---|
| Quadrant | BADHDUFLAG | Total packets | Discarded packets |
| A | 0 | 191719 | 0 |
| B | 0 | 196069 | 0 |
| C | 0 | 187301 | 0 |
| D | 0 | 220929 | 0 |
| Mode M9 | |||
|---|---|---|---|
| Quadrant | BADHDUFLAG | Total packets | Discarded packets |
| A | 0 | 119 | 0 |
| B | 0 | 119 | 0 |
| C | 0 | 119 | 0 |
| D | 0 | 119 | 0 |
| Mode SS | |||
|---|---|---|---|
| Quadrant | BADHDUFLAG | Total packets | Discarded packets |
| A | 0 | 1850 | 0 |
| B | 0 | 1850 | 0 |
| C | 0 | 1848 | 0 |
| D | 0 | 1850 | 0 |
| Quadrant | Total seconds | Saturated seconds | Saturation percentage |
|---|---|---|---|
| A | 91269 | 1546 | 1.693894% |
| B | 91273 | 1499 | 1.642326% |
| C | 91272 | 987 | 1.081383% |
| D | 91267 | 3037 | 3.327599% |
Noise dominated data is calculated using 1-second bins in cleaned event files. If a bin has >2000 counts, and if more than 50% of those come from <1% of pixels, then it is considered to be noise-dominated and hence unusable.
| Quadrant | # 1 sec bins | Bins with >0 counts | Bins with >2000 counts | High rate bins dominated by noise | Noise dominated (total time) | Noise dominated (detector-on time) | Marked lightcurve |
|---|---|---|---|---|---|---|---|
| A | 102883 | 91296 | 247 | 247 | 0.24% | 0.27% |  |
| B | 102883 | 91296 | 89 | 89 | 0.09% | 0.10% |  |
| C | 102883 | 91296 | 1 | 1 | 0.00% | 0.00% |  |
| D | 102882 | 91295 | 1764 | 1764 | 1.71% | 1.93% |  |
Top three noisy pixels from each quadrant. If the there are fewer than three noisy pixels in the level2.evt file, extra rows are filled as -1
| Pixel properties | Quadrant properties | ||||||
|---|---|---|---|---|---|---|---|
| Quadrant | DetID | PixID | Counts | Sigma | Mean | Median | Sigma |
| A | 0 | 50 | 1327813 | 612.97 | 10624 | 10394 | 2149.2 |
| A | 15 | 174 | 243735 | 108.57 | 10624 | 10394 | 2149.2 |
| A | 0 | 247 | 162589 | 70.81 | 10624 | 10394 | 2149.2 |
| B | 15 | 204 | 2130410 | 1035.4 | 10762 | 10511 | 2047.4 |
| B | 0 | 219 | 558257 | 267.53 | 10762 | 10511 | 2047.4 |
| B | 4 | 48 | 389282 | 185.0 | 10762 | 10511 | 2047.4 |
| C | 13 | 61 | 84377 | 31.23 | 10320 | 10373 | 2370.0 |
| C | 14 | 67 | 69028 | 24.75 | 10320 | 10373 | 2370.0 |
| C | 9 | 247 | 57518 | 19.89 | 10320 | 10373 | 2370.0 |
| D | 2 | 33 | 3231266 | 1283.17 | 10228 | 9910 | 2510.5 |
| D | 2 | 152 | 2637404 | 1046.61 | 10228 | 9910 | 2510.5 |
| D | 4 | 95 | 2042259 | 809.55 | 10228 | 9910 | 2510.5 |
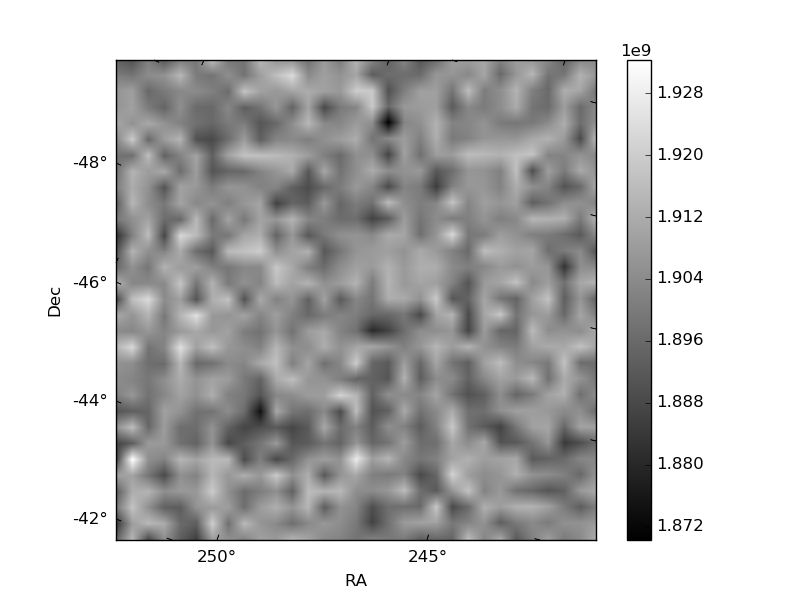
Histogram calculated using DETX and DETY for each event in the final _common_clean file
| Quadrant A |  |
 |
Quadrant B |
|---|---|---|---|
| Quadrant D |  |
 |
Quadrant C |
| Plot type | Count rate plots | Images |
|---|---|---|
| Comparison with Poisson distribution Blue bars denote a histogram of data divided into 1 sec bins. Red curve is a Poisson curve with rate = median count rate of data. |
 |
 |
| Quadrant-wise count rates Data is divided into 100 sec bins |
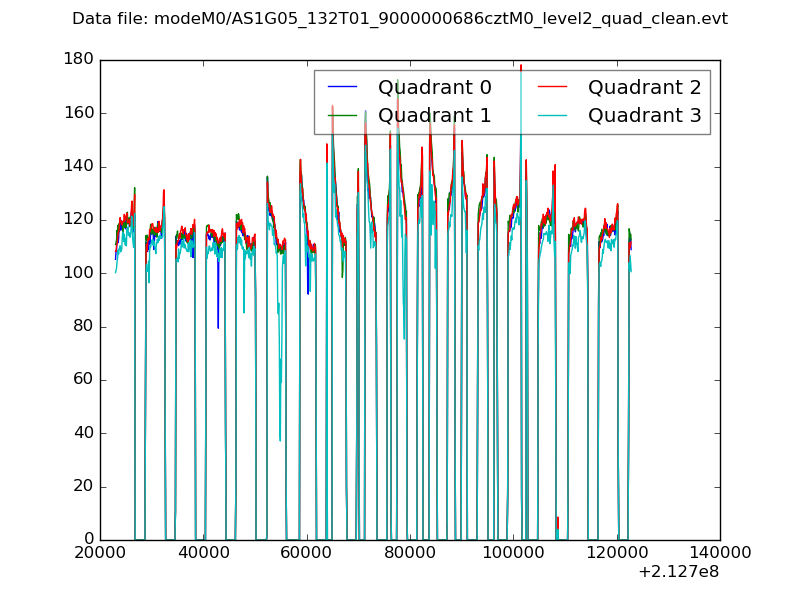 |
|
| Module-wise count rates for Quadrant A Data is divided into 100 sec bins |
 |
 |
| Module-wise count rates for Quadrant B Data is divided into 100 sec bins |
 |
 |
| Module-wise count rates for Quadrant C Data is divided into 100 sec bins |
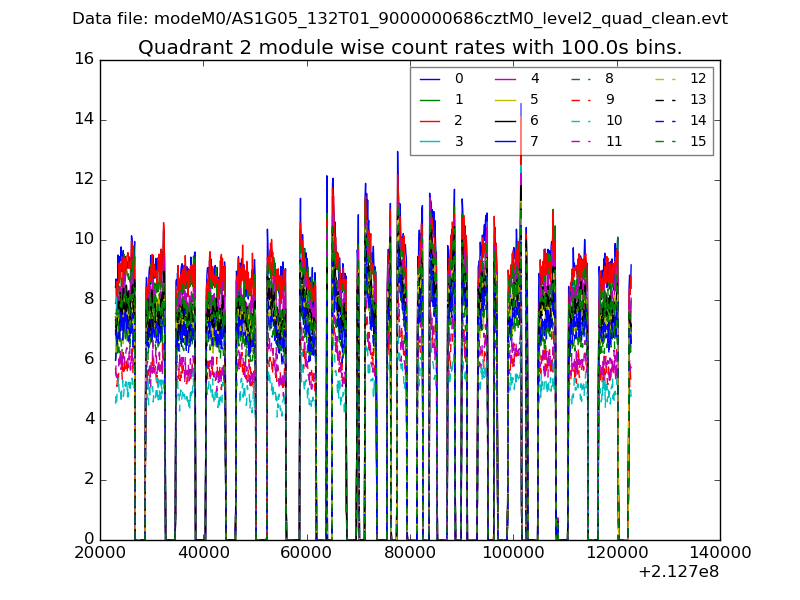 |
 |
| Module-wise count rates for Quadrant D Data is divided into 100 sec bins |
 |
 |
| Parameter | Plot |
|---|---|
| CZT HV Monitor |  |
| D_VDD |  |
| Temperature 1 | 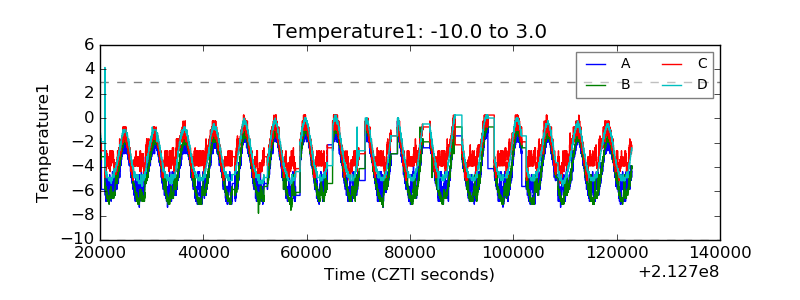 |
| Veto HV Monitor |  |
| Veto LLD |  |
| Alpha Counter |  |
| _CPM_Rate | 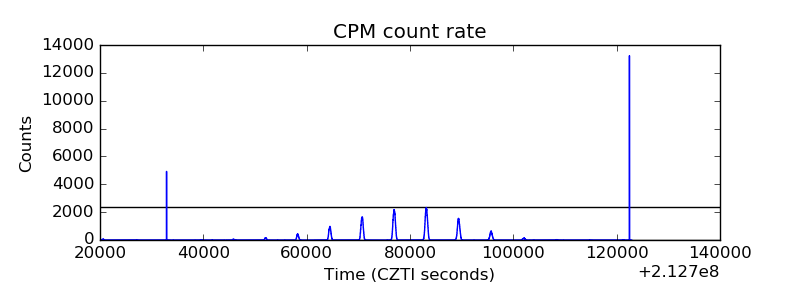 |
| CZT Counter |  |
| +2.5 Volts monitor |  |
| +5 Volts monitor |  |
| _ROLL_ROT |  |
| _Roll_DEC |  |
| _Roll_RA |  |
| Veto Counter |  |