| Param | Original file | Final file |
|---|---|---|
| Filename | modeM0/AS1G05_214T01_9000000684cztM0_level2.evt | modeM0/AS1G05_214T01_9000000684cztM0_level2_quad_clean.evt |
| Size (bytes) | 15,825,139,200 | 2,048,607,360 |
| Size | 14.7 GB | 1.9 GB |
| Events in quadrant A | 83,423,261 | 12,835,316 |
| Events in quadrant B | 87,480,017 | 13,012,208 |
| Events in quadrant C | 88,530,660 | 12,933,691 |
| Events in quadrant D | 208,036,592 | 11,238,729 |
| Mode M9 | |||
|---|---|---|---|
| Quadrant | BADHDUFLAG | Total packets | Discarded packets |
| A | 0 | 273 | 0 |
| B | 0 | 273 | 0 |
| C | 0 | 273 | 0 |
| D | 0 | 273 | 0 |
| Mode M0 | |||
|---|---|---|---|
| Quadrant | BADHDUFLAG | Total packets | Discarded packets |
| A | 0 | 368805 | 0 |
| B | 0 | 375784 | 0 |
| C | 0 | 378803 | 0 |
| D | 0 | 740043 | 0 |
| Mode SS | |||
|---|---|---|---|
| Quadrant | BADHDUFLAG | Total packets | Discarded packets |
| A | 0 | 3574 | 0 |
| B | 0 | 3572 | 0 |
| C | 0 | 3574 | 0 |
| D | 0 | 3574 | 0 |
| Quadrant | Total seconds | Saturated seconds | Saturation percentage |
|---|---|---|---|
| A | 175515 | 2811 | 1.601573% |
| B | 175493 | 3152 | 1.796083% |
| C | 175473 | 2021 | 1.151744% |
| D | 175482 | 30498 | 17.379560% |
Noise dominated data is calculated using 1-second bins in cleaned event files. If a bin has >2000 counts, and if more than 50% of those come from <1% of pixels, then it is considered to be noise-dominated and hence unusable.
| Quadrant | # 1 sec bins | Bins with >0 counts | Bins with >2000 counts | High rate bins dominated by noise | Noise dominated (total time) | Noise dominated (detector-on time) | Marked lightcurve |
|---|---|---|---|---|---|---|---|
| A | 203398 | 175619 | 290 | 290 | 0.14% | 0.17% |  |
| B | 203398 | 175600 | 322 | 322 | 0.16% | 0.18% |  |
| C | 203398 | 175578 | 249 | 249 | 0.12% | 0.14% |  |
| D | 203398 | 175583 | 32562 | 32562 | 16.01% | 18.55% |  |
Top three noisy pixels from each quadrant. If the there are fewer than three noisy pixels in the level2.evt file, extra rows are filled as -1
| Pixel properties | Quadrant properties | ||||||
|---|---|---|---|---|---|---|---|
| Quadrant | DetID | PixID | Counts | Sigma | Mean | Median | Sigma |
| A | 0 | 50 | 1529798 | 359.03 | 20807 | 20368 | 4204.2 |
| A | 15 | 174 | 749873 | 173.52 | 20807 | 20368 | 4204.2 |
| A | 13 | 6 | 413796 | 93.58 | 20807 | 20368 | 4204.2 |
| B | 15 | 204 | 1791447 | 441.73 | 21107 | 20629 | 4008.9 |
| B | 10 | 16 | 850248 | 206.95 | 21107 | 20629 | 4008.9 |
| B | 0 | 219 | 726285 | 176.02 | 21107 | 20629 | 4008.9 |
| C | 1 | 16 | 7559896 | 1598.94 | 20306 | 20430 | 4715.3 |
| C | 9 | 247 | 1462765 | 305.88 | 20306 | 20430 | 4715.3 |
| C | 14 | 67 | 227424 | 43.9 | 20306 | 20430 | 4715.3 |
| D | 7 | 237 | 82573543 | 17591.87 | 19192 | 18610 | 4692.8 |
| D | 2 | 63 | 41515578 | 8842.71 | 19192 | 18610 | 4692.8 |
| D | 2 | 33 | 2284341 | 482.81 | 19192 | 18610 | 4692.8 |
Histogram calculated using DETX and DETY for each event in the final _common_clean file
| Quadrant A |  |
 |
Quadrant B |
|---|---|---|---|
| Quadrant D |  |
 |
Quadrant C |
| Plot type | Count rate plots | Images |
|---|---|---|
| Comparison with Poisson distribution Blue bars denote a histogram of data divided into 1 sec bins. Red curve is a Poisson curve with rate = median count rate of data. |
 |
 |
| Quadrant-wise count rates Data is divided into 100 sec bins |
 |
|
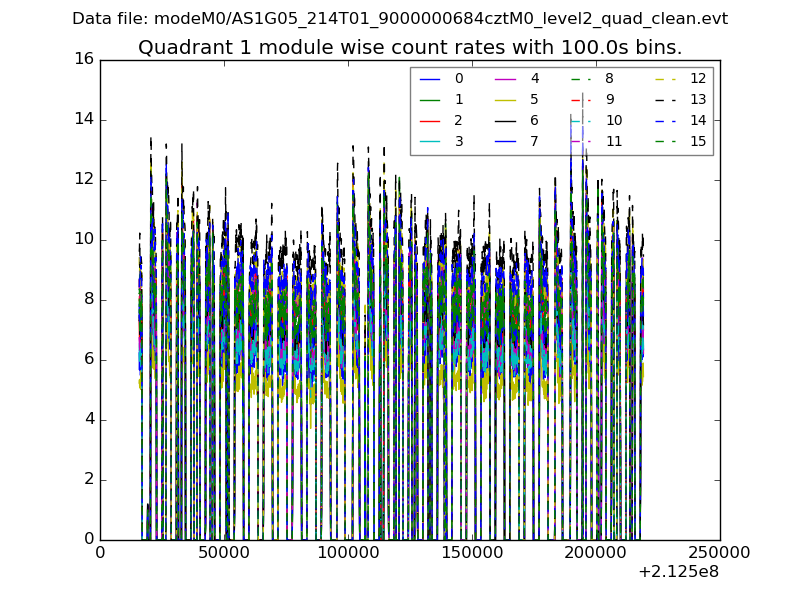
| Module-wise count rates for Quadrant A Data is divided into 100 sec bins |
 |
 |
| Module-wise count rates for Quadrant B Data is divided into 100 sec bins |
 |
 |
| Module-wise count rates for Quadrant C Data is divided into 100 sec bins |
 |
 |
| Module-wise count rates for Quadrant D Data is divided into 100 sec bins |
 |
 |
| Parameter | Plot |
|---|---|
| CZT HV Monitor |  |
| D_VDD |  |
| Temperature 1 |  |
| Veto HV Monitor |  |
| Veto LLD | 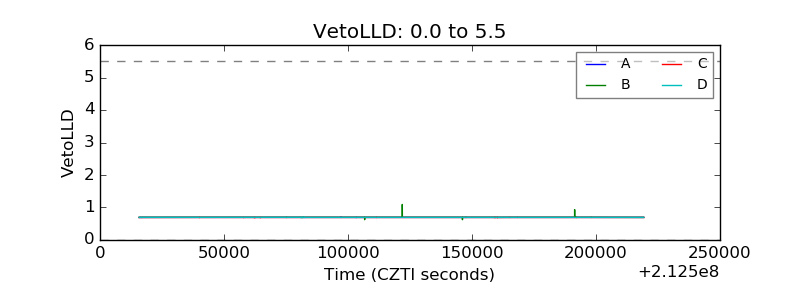 |
| Alpha Counter |  |
| _CPM_Rate |  |
| CZT Counter | 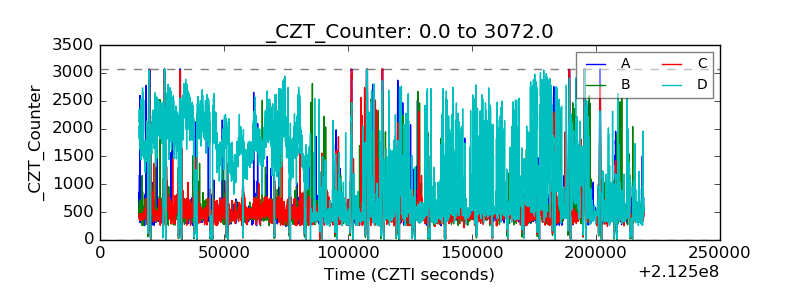 |
| +2.5 Volts monitor |  |
| +5 Volts monitor | 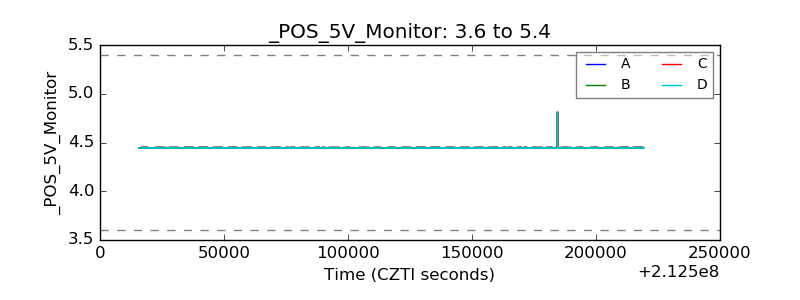 |
| _ROLL_ROT |  |
| _Roll_DEC |  |
| _Roll_RA |  |
| Veto Counter |  |