| Param | Original file | Final file |
|---|---|---|
| Filename | modeM0/AS1G05_021T02_9000000680cztM0_level2_bc.evt | modeM0/AS1G05_021T02_9000000680cztM0_level2_quad_clean.evt |
| Size (bytes) | 2,614,711,680 | 711,483,840 |
| Size | 2.4 GB | 678.5 MB |
| Events in quadrant A | 15,994,571 | 4,225,462 |
| Events in quadrant B | 15,331,363 | 4,308,300 |
| Events in quadrant C | 16,400,688 | 4,312,623 |
| Events in quadrant D | 26,697,946 | 3,910,184 |
| Mode M0 | |||
|---|---|---|---|
| Quadrant | BADHDUFLAG | Total packets | Discarded packets |
| A | 0 | 153381 | 0 |
| B | 0 | 149469 | 0 |
| C | 0 | 148099 | 0 |
| D | 0 | 192010 | 0 |
| Mode SS | |||
|---|---|---|---|
| Quadrant | BADHDUFLAG | Total packets | Discarded packets |
| A | 0 | 1418 | 0 |
| B | 0 | 1418 | 0 |
| C | 0 | 1418 | 0 |
| D | 0 | 1418 | 0 |
| Mode M9 | |||
|---|---|---|---|
| Quadrant | BADHDUFLAG | Total packets | Discarded packets |
| A | 0 | 104 | 0 |
| B | 0 | 104 | 0 |
| C | 0 | 104 | 0 |
| D | 0 | 104 | 0 |
| Quadrant | Total seconds | Saturated seconds | Saturation percentage |
|---|---|---|---|
| A | 69877 | 1646 | 2.355568% |
| B | 69881 | 1223 | 1.750118% |
| C | 69877 | 864 | 1.236458% |
| D | 69865 | 4824 | 6.904745% |
Noise dominated data is calculated using 1-second bins in cleaned event files. If a bin has >2000 counts, and if more than 50% of those come from <1% of pixels, then it is considered to be noise-dominated and hence unusable.
| Quadrant | # 1 sec bins | Bins with >0 counts | Bins with >2000 counts | High rate bins dominated by noise | Noise dominated (total time) | Noise dominated (detector-on time) | Marked lightcurve |
|---|---|---|---|---|---|---|---|
| A | 80244 | 69880 | 80 | 80 | 0.10% | 0.11% |  |
| B | 80244 | 69880 | 13 | 13 | 0.02% | 0.02% |  |
| C | 80244 | 69882 | 7 | 7 | 0.01% | 0.01% |  |
| D | 80244 | 69875 | 1004 | 1004 | 1.25% | 1.44% |  |
Top three noisy pixels from each quadrant. If the there are fewer than three noisy pixels in the level2.evt file, extra rows are filled as -1
| Pixel properties | Quadrant properties | ||||||
|---|---|---|---|---|---|---|---|
| Quadrant | DetID | PixID | Counts | Sigma | Mean | Median | Sigma |
| A | 15 | 174 | 1724578 | 2279.14 | 3369 | 3288 | 755.2 |
| A | 0 | 50 | 1049581 | 1385.39 | 3369 | 3288 | 755.2 |
| A | 13 | 251 | 144788 | 187.36 | 3369 | 3288 | 755.2 |
| B | 4 | 80 | 571569 | 851.53 | 3456 | 3347 | 667.3 |
| B | 15 | 204 | 294475 | 436.28 | 3456 | 3347 | 667.3 |
| B | 0 | 219 | 197468 | 290.91 | 3456 | 3347 | 667.3 |
| C | 1 | 16 | 2957027 | 3966.97 | 3356 | 3290 | 744.6 |
| C | 9 | 247 | 245493 | 325.29 | 3356 | 3290 | 744.6 |
| C | 14 | 67 | 44542 | 55.4 | 3356 | 3290 | 744.6 |
| D | 7 | 237 | 10486113 | 13707.4 | 3205 | 3071 | 764.8 |
| D | 2 | 136 | 924256 | 1204.52 | 3205 | 3071 | 764.8 |
| D | 4 | 95 | 796300 | 1037.21 | 3205 | 3071 | 764.8 |
Histogram calculated using DETX and DETY for each event in the final _common_clean file
| Quadrant A |  |
 |
Quadrant B |
|---|---|---|---|
| Quadrant D | 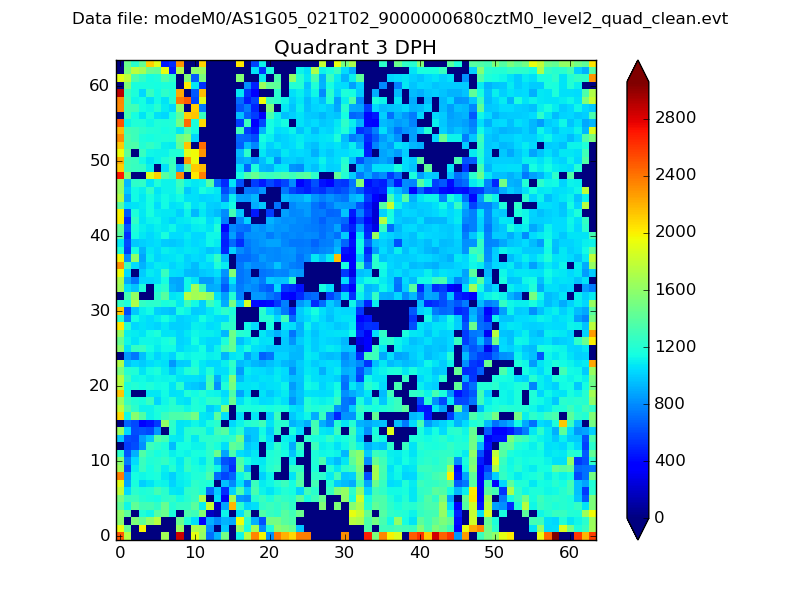 |
 |
Quadrant C |
| Plot type | Count rate plots | Images |
|---|---|---|
| Comparison with Poisson distribution Blue bars denote a histogram of data divided into 1 sec bins. Red curve is a Poisson curve with rate = median count rate of data. |
 |
 |
| Quadrant-wise count rates Data is divided into 100 sec bins |
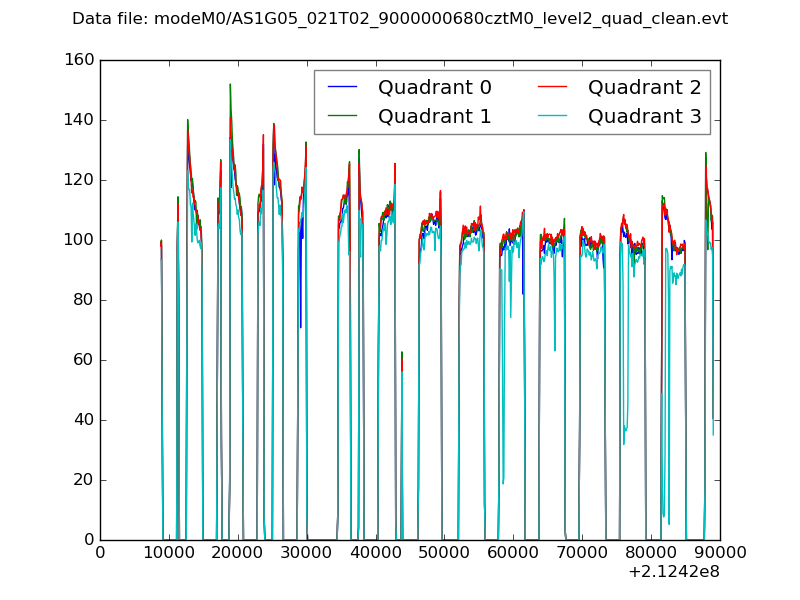 |
|
| Module-wise count rates for Quadrant A Data is divided into 100 sec bins |
 |
 |
| Module-wise count rates for Quadrant B Data is divided into 100 sec bins |
 |
 |
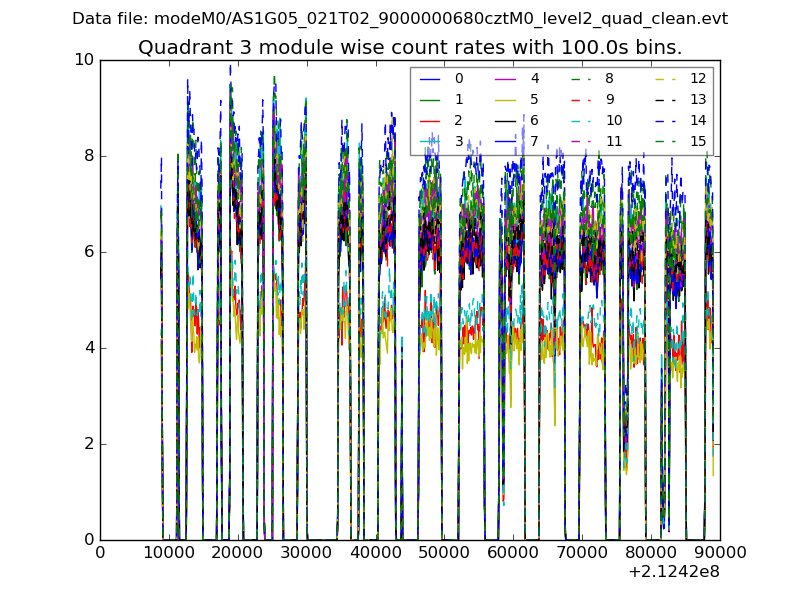
| Module-wise count rates for Quadrant C Data is divided into 100 sec bins |
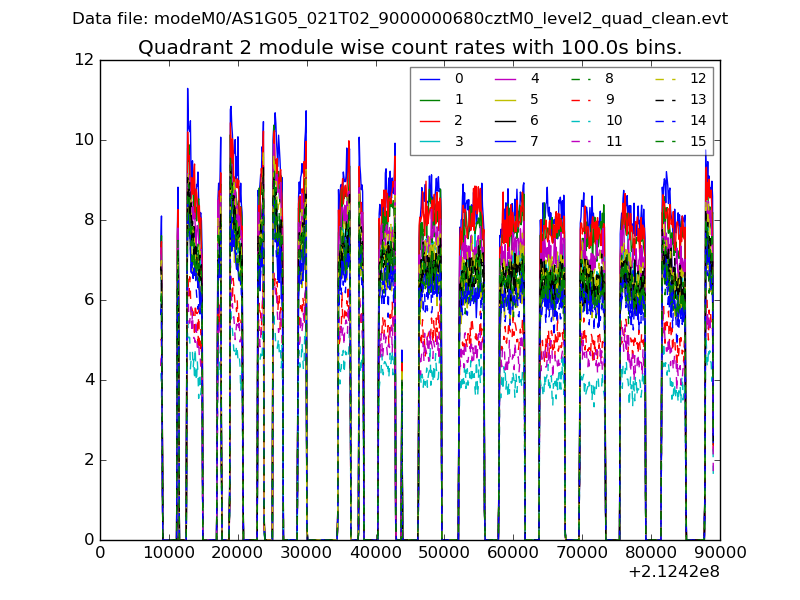 |
 |
| Module-wise count rates for Quadrant D Data is divided into 100 sec bins |
 |
 |
| Parameter | Plot |
|---|---|
| CZT HV Monitor |  |
| D_VDD |  |
| Temperature 1 |  |
| Veto HV Monitor |  |
| Veto LLD |  |
| Alpha Counter |  |
| _CPM_Rate |  |
| CZT Counter |  |
| +2.5 Volts monitor |  |
| +5 Volts monitor | 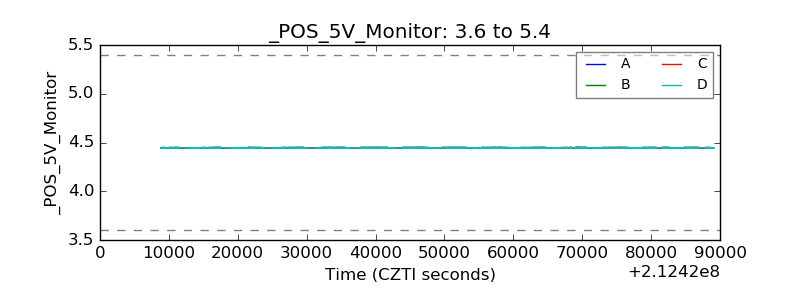 |
| _ROLL_ROT |  |
| _Roll_DEC |  |
| _Roll_RA |  |
| Veto Counter |  |