| Param | Original file | Final file |
|---|---|---|
| Filename | modeM0/AS1G05_106T01_9000000678cztM0_level2.evt | modeM0/AS1G05_106T01_9000000678cztM0_level2_quad_clean.evt |
| Size (bytes) | 6,188,002,560 | 1,026,169,920 |
| Size | 5.8 GB | 978.6 MB |
| Events in quadrant A | 43,181,037 | 6,290,439 |
| Events in quadrant B | 47,517,022 | 6,545,169 |
| Events in quadrant C | 40,635,399 | 6,325,722 |
| Events in quadrant D | 50,154,243 | 5,908,862 |
| Mode M0 | |||
|---|---|---|---|
| Quadrant | BADHDUFLAG | Total packets | Discarded packets |
| A | 0 | 189626 | 0 |
| B | 0 | 199039 | 0 |
| C | 0 | 182270 | 0 |
| D | 0 | 209899 | 0 |
| Mode M9 | |||
|---|---|---|---|
| Quadrant | BADHDUFLAG | Total packets | Discarded packets |
| A | 0 | 136 | 0 |
| B | 0 | 136 | 0 |
| C | 0 | 134 | 0 |
| D | 0 | 136 | 0 |
| Mode SS | |||
|---|---|---|---|
| Quadrant | BADHDUFLAG | Total packets | Discarded packets |
| A | 0 | 1794 | 0 |
| B | 0 | 1782 | 0 |
| C | 0 | 1794 | 0 |
| D | 0 | 1788 | 0 |
| Quadrant | Total seconds | Saturated seconds | Saturation percentage |
|---|---|---|---|
| A | 87679 | 2112 | 2.408787% |
| B | 87722 | 1877 | 2.139714% |
| C | 87707 | 905 | 1.031845% |
| D | 87618 | 3478 | 3.969504% |
Noise dominated data is calculated using 1-second bins in cleaned event files. If a bin has >2000 counts, and if more than 50% of those come from <1% of pixels, then it is considered to be noise-dominated and hence unusable.
| Quadrant | # 1 sec bins | Bins with >0 counts | Bins with >2000 counts | High rate bins dominated by noise | Noise dominated (total time) | Noise dominated (detector-on time) | Marked lightcurve |
|---|---|---|---|---|---|---|---|
| A | 102424 | 88230 | 761 | 761 | 0.74% | 0.86% |  |
| B | 102424 | 88259 | 541 | 541 | 0.53% | 0.61% |  |
| C | 102424 | 88252 | 18 | 18 | 0.02% | 0.02% |  |
| D | 102424 | 88206 | 2538 | 2538 | 2.48% | 2.88% |  |
Top three noisy pixels from each quadrant. If the there are fewer than three noisy pixels in the level2.evt file, extra rows are filled as -1
| Pixel properties | Quadrant properties | ||||||
|---|---|---|---|---|---|---|---|
| Quadrant | DetID | PixID | Counts | Sigma | Mean | Median | Sigma |
| A | 0 | 50 | 2112160 | 1019.3 | 10186 | 9969 | 2062.4 |
| A | 15 | 174 | 1716639 | 827.52 | 10186 | 9969 | 2062.4 |
| A | 14 | 111 | 154523 | 70.09 | 10186 | 9969 | 2062.4 |
| B | 14 | 167 | 1529263 | 778.07 | 10343 | 10104 | 1952.5 |
| B | 10 | 16 | 1359028 | 690.88 | 10343 | 10104 | 1952.5 |
| B | 4 | 80 | 1149632 | 583.63 | 10343 | 10104 | 1952.5 |
| C | 1 | 16 | 1599218 | 694.78 | 9943 | 9983 | 2287.4 |
| C | 14 | 67 | 89855 | 34.92 | 9943 | 9983 | 2287.4 |
| C | 13 | 61 | 81874 | 31.43 | 9943 | 9983 | 2287.4 |
| D | 2 | 16 | 4492469 | 1881.54 | 9756 | 9455 | 2382.6 |
| D | 2 | 63 | 2803195 | 1172.54 | 9756 | 9455 | 2382.6 |
| D | 4 | 95 | 2235837 | 934.42 | 9756 | 9455 | 2382.6 |
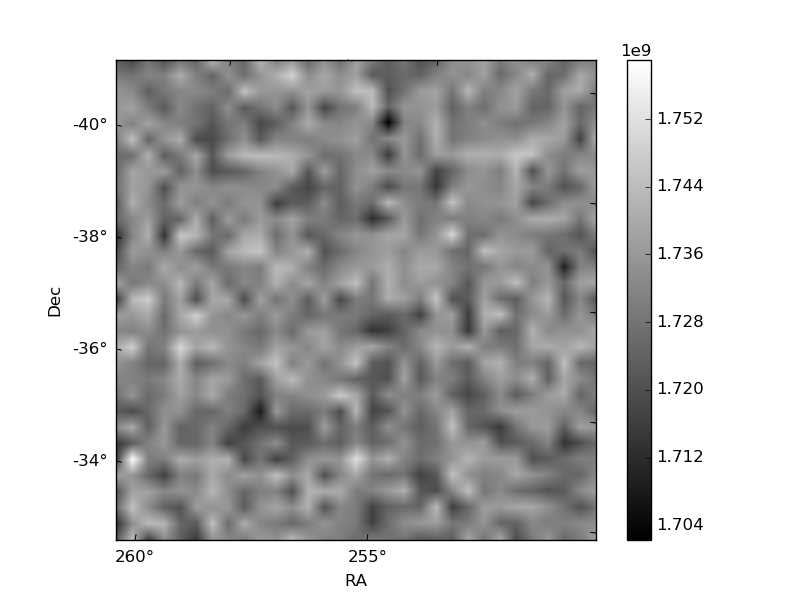
Histogram calculated using DETX and DETY for each event in the final _common_clean file
| Quadrant A |  |
 |
Quadrant B |
|---|---|---|---|
| Quadrant D |  |
 |
Quadrant C |
| Plot type | Count rate plots | Images |
|---|---|---|
| Comparison with Poisson distribution Blue bars denote a histogram of data divided into 1 sec bins. Red curve is a Poisson curve with rate = median count rate of data. |
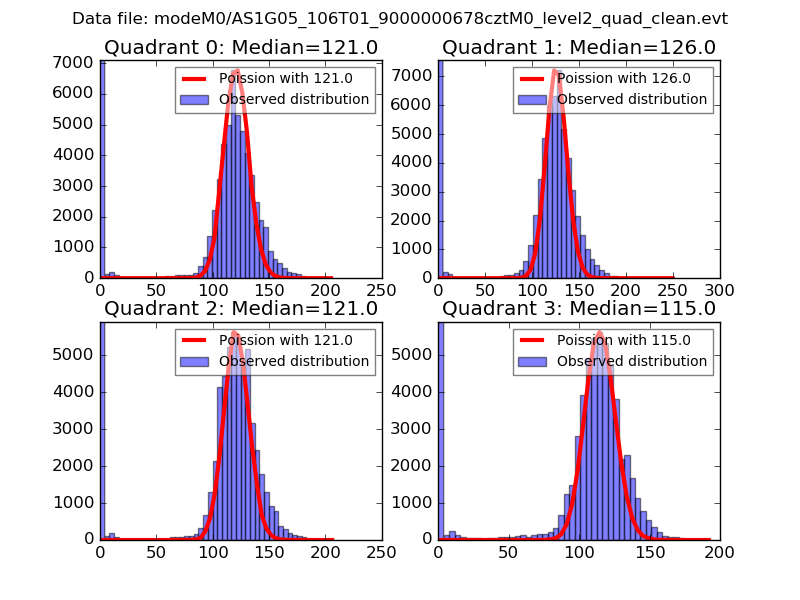 |
 |
| Quadrant-wise count rates Data is divided into 100 sec bins |
 |
|
| Module-wise count rates for Quadrant A Data is divided into 100 sec bins |
 |
 |
| Module-wise count rates for Quadrant B Data is divided into 100 sec bins |
 |
 |
| Module-wise count rates for Quadrant C Data is divided into 100 sec bins |
 |
 |
| Module-wise count rates for Quadrant D Data is divided into 100 sec bins |
 |
 |
| Parameter | Plot |
|---|---|
| CZT HV Monitor |  |
| D_VDD | 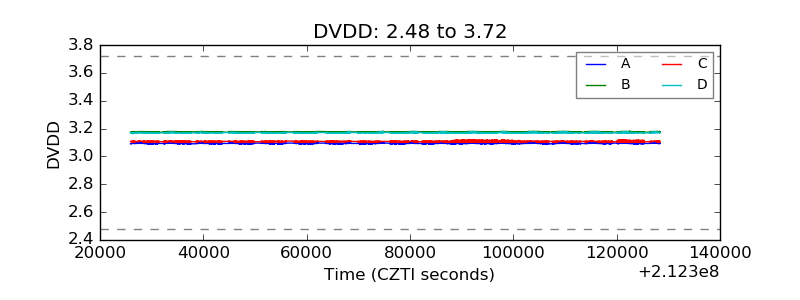 |
| Temperature 1 |  |
| Veto HV Monitor | 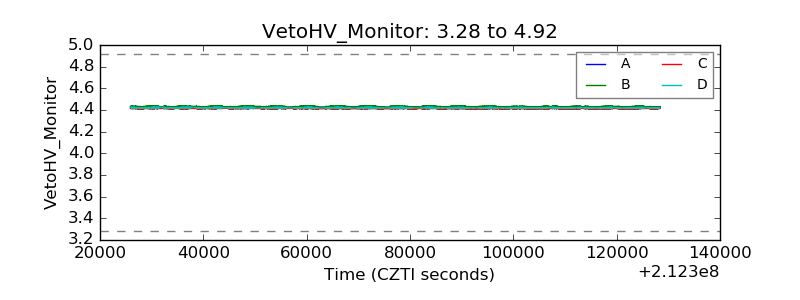 |
| Veto LLD |  |
| Alpha Counter |  |
| _CPM_Rate |  |
| CZT Counter |  |
| +2.5 Volts monitor |  |
| +5 Volts monitor | 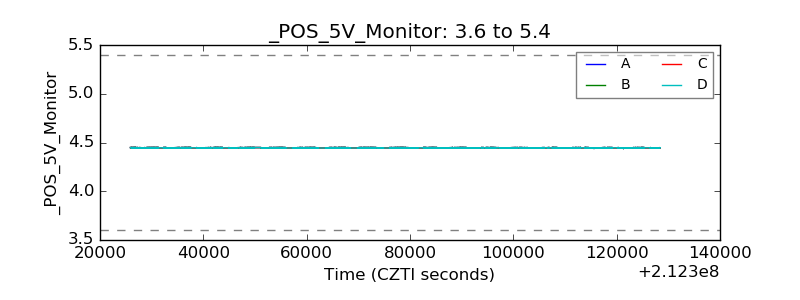 |
| _ROLL_ROT |  |
| _Roll_DEC |  |
| _Roll_RA |  |
| Veto Counter |  |