| Param | Original file | Final file |
|---|---|---|
| Filename | modeM0/AS1G05_240T01_9000000674cztM0_level2.evt | modeM0/AS1G05_240T01_9000000674cztM0_level2_quad_clean.evt |
| Size (bytes) | 12,077,962,560 | 2,308,291,200 |
| Size | 11.2 GB | 2.1 GB |
| Events in quadrant A | 84,392,065 | 14,517,113 |
| Events in quadrant B | 88,986,810 | 14,940,120 |
| Events in quadrant C | 88,663,236 | 14,444,531 |
| Events in quadrant D | 91,630,219 | 13,724,670 |
| Mode M9 | |||
|---|---|---|---|
| Quadrant | BADHDUFLAG | Total packets | Discarded packets |
| A | 0 | 261 | 0 |
| B | 0 | 264 | 0 |
| C | 0 | 266 | 0 |
| D | 0 | 265 | 0 |
| Mode SS | |||
|---|---|---|---|
| Quadrant | BADHDUFLAG | Total packets | Discarded packets |
| A | 0 | 3656 | 0 |
| B | 0 | 3662 | 0 |
| C | 0 | 3644 | 0 |
| D | 0 | 3654 | 0 |
| Mode M0 | |||
|---|---|---|---|
| Quadrant | BADHDUFLAG | Total packets | Discarded packets |
| A | 0 | 376507 | 0 |
| B | 0 | 385848 | 0 |
| C | 0 | 386138 | 0 |
| D | 0 | 399778 | 0 |
| Quadrant | Total seconds | Saturated seconds | Saturation percentage |
|---|---|---|---|
| A | 179520 | 2868 | 1.597594% |
| B | 179481 | 3092 | 1.722745% |
| C | 179027 | 1822 | 1.017724% |
| D | 179435 | 3650 | 2.034163% |
Noise dominated data is calculated using 1-second bins in cleaned event files. If a bin has >2000 counts, and if more than 50% of those come from <1% of pixels, then it is considered to be noise-dominated and hence unusable.
| Quadrant | # 1 sec bins | Bins with >0 counts | Bins with >2000 counts | High rate bins dominated by noise | Noise dominated (total time) | Noise dominated (detector-on time) | Marked lightcurve |
|---|---|---|---|---|---|---|---|
| A | 226383 | 181888 | 258 | 258 | 0.11% | 0.14% |  |
| B | 226383 | 181881 | 456 | 456 | 0.20% | 0.25% |  |
| C | 226383 | 181552 | 8 | 8 | 0.00% | 0.00% |  |
| D | 226383 | 181808 | 1601 | 1601 | 0.71% | 0.88% |  |
Top three noisy pixels from each quadrant. If the there are fewer than three noisy pixels in the level2.evt file, extra rows are filled as -1
| Pixel properties | Quadrant properties | ||||||
|---|---|---|---|---|---|---|---|
| Quadrant | DetID | PixID | Counts | Sigma | Mean | Median | Sigma |
| A | 0 | 247 | 1379522 | 320.76 | 20896 | 20419 | 4237.1 |
| A | 0 | 50 | 1291971 | 300.1 | 20896 | 20419 | 4237.1 |
| A | 13 | 251 | 753323 | 172.97 | 20896 | 20419 | 4237.1 |
| B | 10 | 16 | 3056261 | 759.37 | 21213 | 20737 | 3997.4 |
| B | 4 | 48 | 1424794 | 351.24 | 21213 | 20737 | 3997.4 |
| B | 4 | 80 | 920456 | 225.08 | 21213 | 20737 | 3997.4 |
| C | 1 | 16 | 8710848 | 1839.83 | 20434 | 20522 | 4723.4 |
| C | 13 | 61 | 165622 | 30.72 | 20434 | 20522 | 4723.4 |
| C | 14 | 67 | 142344 | 25.79 | 20434 | 20522 | 4723.4 |
| D | 2 | 234 | 2792325 | 561.32 | 20310 | 19725 | 4939.4 |
| D | 2 | 136 | 2583806 | 519.11 | 20310 | 19725 | 4939.4 |
| D | 8 | 195 | 2096108 | 420.37 | 20310 | 19725 | 4939.4 |
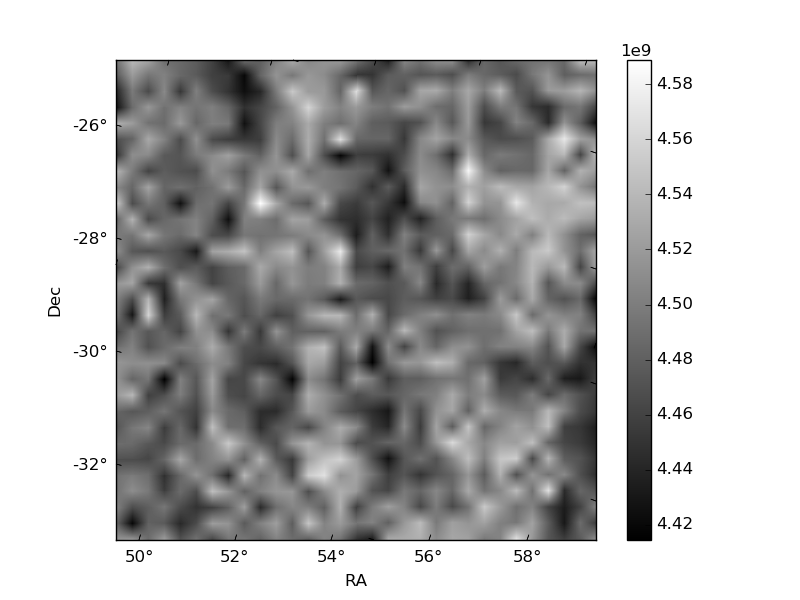
Histogram calculated using DETX and DETY for each event in the final _common_clean file
| Quadrant A |  |
 |
Quadrant B |
|---|---|---|---|
| Quadrant D | 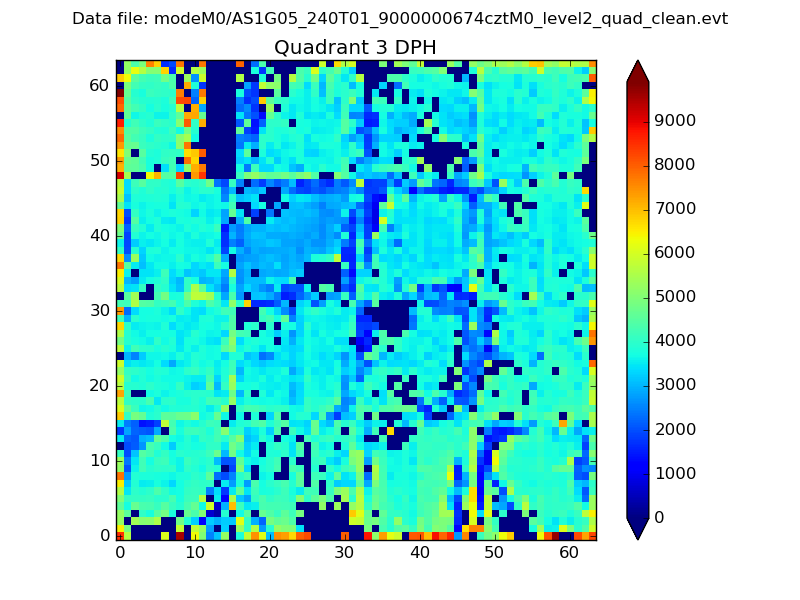 |
 |
Quadrant C |
| Plot type | Count rate plots | Images |
|---|---|---|
| Comparison with Poisson distribution Blue bars denote a histogram of data divided into 1 sec bins. Red curve is a Poisson curve with rate = median count rate of data. |
 |
 |
| Quadrant-wise count rates Data is divided into 100 sec bins |
 |
|
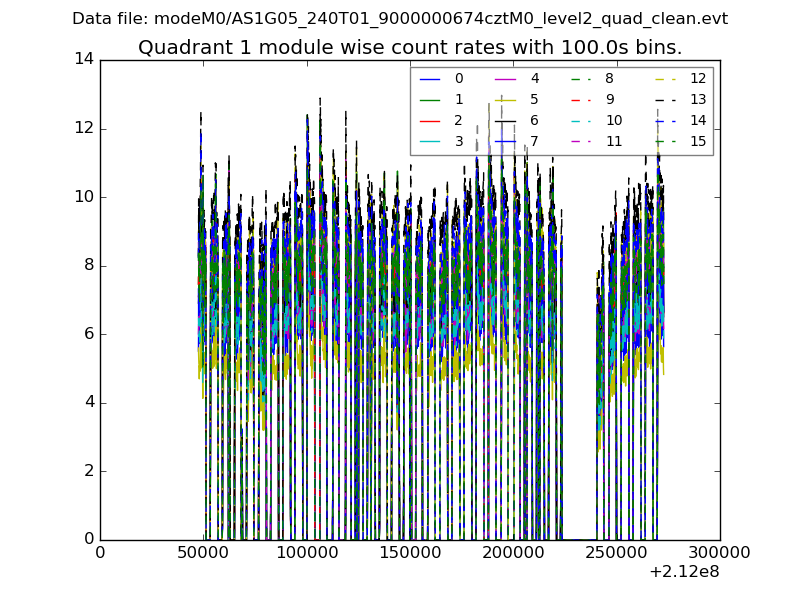
| Module-wise count rates for Quadrant A Data is divided into 100 sec bins |
 |
 |
| Module-wise count rates for Quadrant B Data is divided into 100 sec bins |
 |
 |
| Module-wise count rates for Quadrant C Data is divided into 100 sec bins |
 |
 |
| Module-wise count rates for Quadrant D Data is divided into 100 sec bins |
 |
 |
| Parameter | Plot |
|---|---|
| CZT HV Monitor |  |
| D_VDD |  |
| Temperature 1 |  |
| Veto HV Monitor |  |
| Veto LLD |  |
| Alpha Counter |  |
| _CPM_Rate |  |
| CZT Counter | 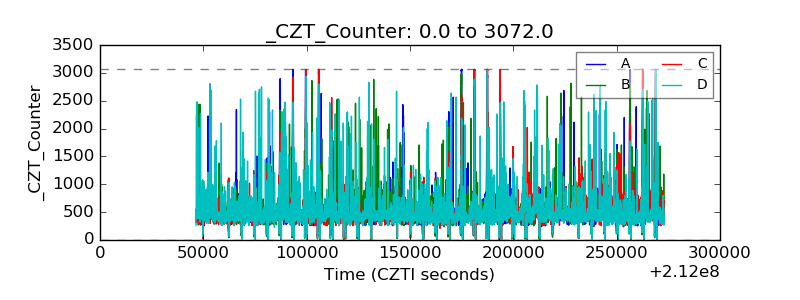 |
| +2.5 Volts monitor |  |
| +5 Volts monitor | 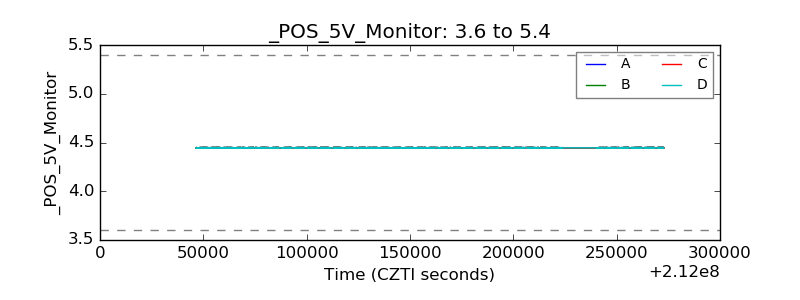 |
| _ROLL_ROT |  |
| _Roll_DEC |  |
| _Roll_RA |  |
| Veto Counter |  |