| Param | Original file | Final file |
|---|---|---|
| Filename | modeM0/AS1G05_212T01_9000000672cztM0_level2.evt | modeM0/AS1G05_212T01_9000000672cztM0_level2_quad_clean.evt |
| Size (bytes) | 2,216,191,680 | 480,695,040 |
| Size | 2.1 GB | 458.4 MB |
| Events in quadrant A | 14,041,879 | 3,202,646 |
| Events in quadrant B | 13,244,778 | 3,321,995 |
| Events in quadrant C | 12,238,329 | 3,319,326 |
| Events in quadrant D | 25,773,412 | 2,861,133 |
| Mode SS | |||
|---|---|---|---|
| Quadrant | BADHDUFLAG | Total packets | Discarded packets |
| A | 0 | 548 | 0 |
| B | 0 | 548 | 0 |
| C | 0 | 548 | 0 |
| D | 0 | 548 | 0 |
| Mode M0 | |||
|---|---|---|---|
| Quadrant | BADHDUFLAG | Total packets | Discarded packets |
| A | 0 | 60751 | 0 |
| B | 0 | 57720 | 0 |
| C | 0 | 54979 | 0 |
| D | 0 | 95509 | 0 |
| Mode M9 | |||
|---|---|---|---|
| Quadrant | BADHDUFLAG | Total packets | Discarded packets |
| A | 0 | 59 | 0 |
| B | 0 | 59 | 0 |
| C | 0 | 59 | 0 |
| D | 0 | 60 | 0 |
| Quadrant | Total seconds | Saturated seconds | Saturation percentage |
|---|---|---|---|
| A | 26976 | 617 | 2.287218% |
| B | 26975 | 222 | 0.822984% |
| C | 26976 | 87 | 0.322509% |
| D | 26976 | 4169 | 15.454478% |
Noise dominated data is calculated using 1-second bins in cleaned event files. If a bin has >2000 counts, and if more than 50% of those come from <1% of pixels, then it is considered to be noise-dominated and hence unusable.
| Quadrant | # 1 sec bins | Bins with >0 counts | Bins with >2000 counts | High rate bins dominated by noise | Noise dominated (total time) | Noise dominated (detector-on time) | Marked lightcurve |
|---|---|---|---|---|---|---|---|
| A | 32716 | 26982 | 533 | 533 | 1.63% | 1.98% |  |
| B | 32716 | 26982 | 43 | 43 | 0.13% | 0.16% |  |
| C | 32716 | 26982 | 0 | 0 | 0.00% | 0.00% |  |
| D | 32716 | 26982 | 3423 | 3423 | 10.46% | 12.69% | 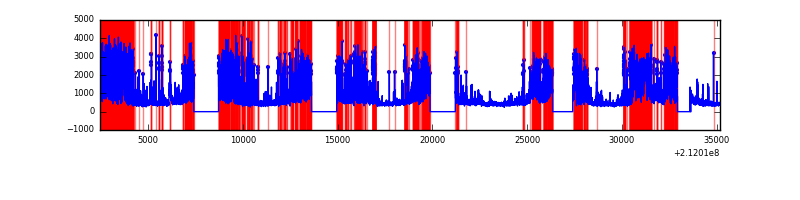 |
Top three noisy pixels from each quadrant. If the there are fewer than three noisy pixels in the level2.evt file, extra rows are filled as -1
| Pixel properties | Quadrant properties | ||||||
|---|---|---|---|---|---|---|---|
| Quadrant | DetID | PixID | Counts | Sigma | Mean | Median | Sigma |
| A | 0 | 50 | 1709499 | 2802.31 | 3043 | 2982 | 609.0 |
| A | 13 | 251 | 606591 | 991.2 | 3043 | 2982 | 609.0 |
| A | 12 | 194 | 30507 | 45.2 | 3043 | 2982 | 609.0 |
| B | 4 | 48 | 672131 | 1165.66 | 3126 | 3052 | 574.0 |
| B | 10 | 16 | 203986 | 350.06 | 3126 | 3052 | 574.0 |
| B | 15 | 204 | 107829 | 182.54 | 3126 | 3052 | 574.0 |
| C | 1 | 16 | 305527 | 437.77 | 3051 | 3062 | 690.9 |
| C | 13 | 61 | 24637 | 31.23 | 3051 | 3062 | 690.9 |
| C | 14 | 67 | 14988 | 17.26 | 3051 | 3062 | 690.9 |
| D | 11 | 145 | 11735397 | 17425.78 | 2800 | 2723 | 673.3 |
| D | 2 | 33 | 1356583 | 2010.8 | 2800 | 2723 | 673.3 |
| D | 2 | 136 | 593846 | 877.96 | 2800 | 2723 | 673.3 |
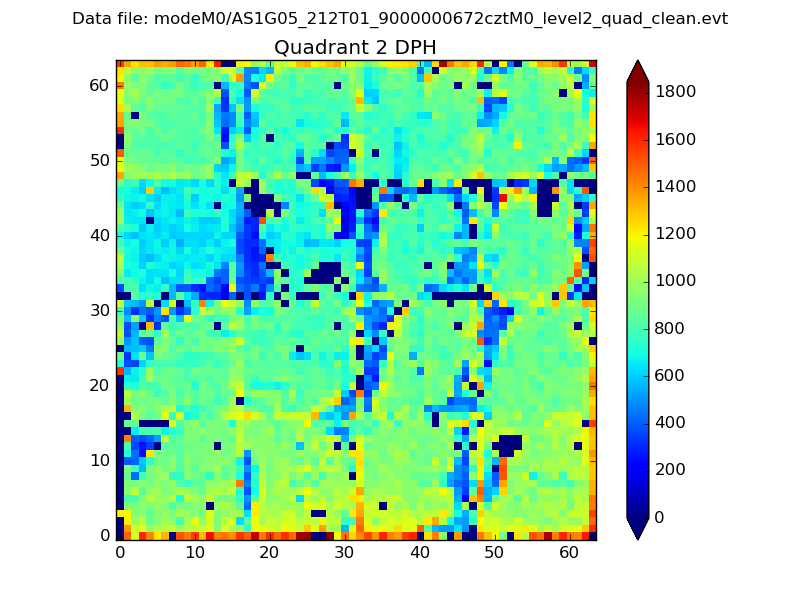
Histogram calculated using DETX and DETY for each event in the final _common_clean file
| Quadrant A |  |
 |
Quadrant B |
|---|---|---|---|
| Quadrant D | 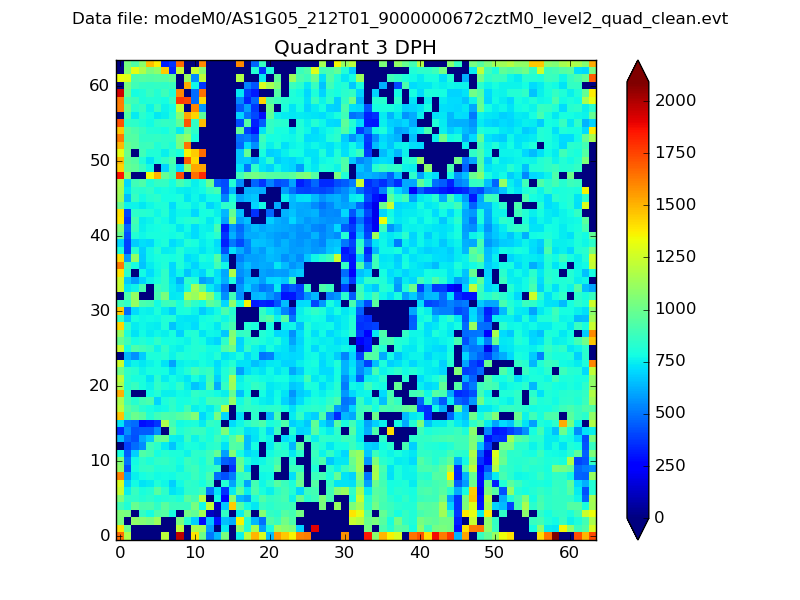 |
 |
Quadrant C |
| Plot type | Count rate plots | Images |
|---|---|---|
| Comparison with Poisson distribution Blue bars denote a histogram of data divided into 1 sec bins. Red curve is a Poisson curve with rate = median count rate of data. |
 |
 |
| Quadrant-wise count rates Data is divided into 100 sec bins |
 |
|
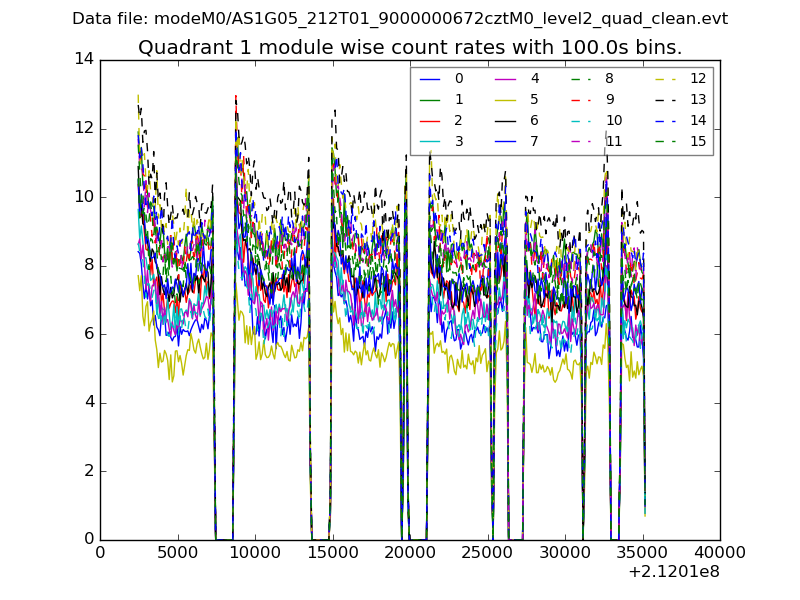
| Module-wise count rates for Quadrant A Data is divided into 100 sec bins |
 |
 |
| Module-wise count rates for Quadrant B Data is divided into 100 sec bins |
 |
 |
| Module-wise count rates for Quadrant C Data is divided into 100 sec bins |
 |
 |
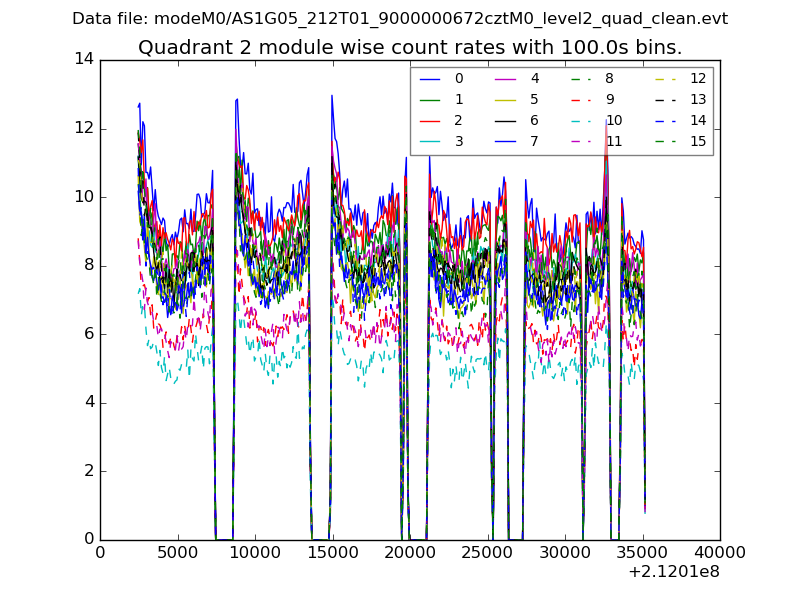
| Module-wise count rates for Quadrant D Data is divided into 100 sec bins |
 |
 |
| Parameter | Plot |
|---|---|
| CZT HV Monitor | 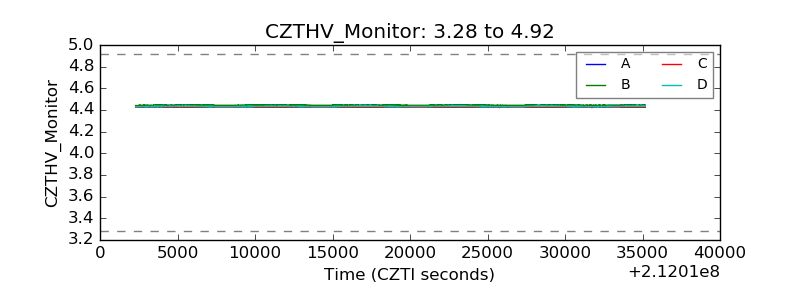 |
| D_VDD |  |
| Temperature 1 |  |
| Veto HV Monitor |  |
| Veto LLD | 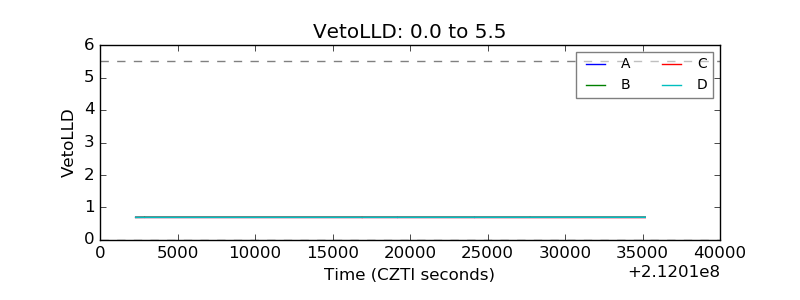 |
| Alpha Counter |  |
| _CPM_Rate | 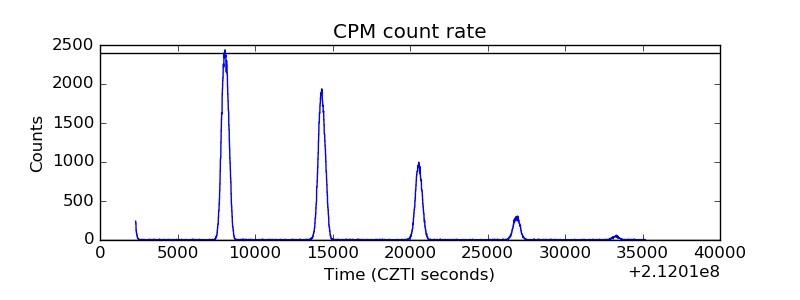 |
| CZT Counter |  |
| +2.5 Volts monitor |  |
| +5 Volts monitor |  |
| _ROLL_ROT |  |
| _Roll_DEC |  |
| _Roll_RA |  |
| Veto Counter |  |