| Param | Original file | Final file |
|---|---|---|
| Filename | modeM0/AS1G05_258T01_9000000666cztM0_level2.evt | modeM0/AS1G05_258T01_9000000666cztM0_level2_quad_clean.evt |
| Size (bytes) | 2,400,284,160 | 493,655,040 |
| Size | 2.2 GB | 470.8 MB |
| Events in quadrant A | 12,956,522 | 3,396,563 |
| Events in quadrant B | 13,671,745 | 3,479,293 |
| Events in quadrant C | 12,416,244 | 3,346,126 |
| Events in quadrant D | 31,741,933 | 2,785,990 |
| Mode SS | |||
|---|---|---|---|
| Quadrant | BADHDUFLAG | Total packets | Discarded packets |
| A | 0 | 578 | 0 |
| B | 0 | 580 | 0 |
| C | 0 | 578 | 0 |
| D | 0 | 576 | 0 |
| Mode M9 | |||
|---|---|---|---|
| Quadrant | BADHDUFLAG | Total packets | Discarded packets |
| A | 0 | 42 | 0 |
| B | 0 | 42 | 0 |
| C | 0 | 42 | 0 |
| D | 0 | 42 | 0 |
| Mode M0 | |||
|---|---|---|---|
| Quadrant | BADHDUFLAG | Total packets | Discarded packets |
| A | 0 | 59056 | 0 |
| B | 0 | 59765 | 0 |
| C | 0 | 57665 | 0 |
| D | 0 | 114209 | 0 |
| Quadrant | Total seconds | Saturated seconds | Saturation percentage |
|---|---|---|---|
| A | 28271 | 384 | 1.358282% |
| B | 28283 | 305 | 1.078386% |
| C | 28277 | 145 | 0.512784% |
| D | 28196 | 6474 | 22.960704% |
Noise dominated data is calculated using 1-second bins in cleaned event files. If a bin has >2000 counts, and if more than 50% of those come from <1% of pixels, then it is considered to be noise-dominated and hence unusable.
| Quadrant | # 1 sec bins | Bins with >0 counts | Bins with >2000 counts | High rate bins dominated by noise | Noise dominated (total time) | Noise dominated (detector-on time) | Marked lightcurve |
|---|---|---|---|---|---|---|---|
| A | 38158 | 28370 | 99 | 99 | 0.26% | 0.35% | 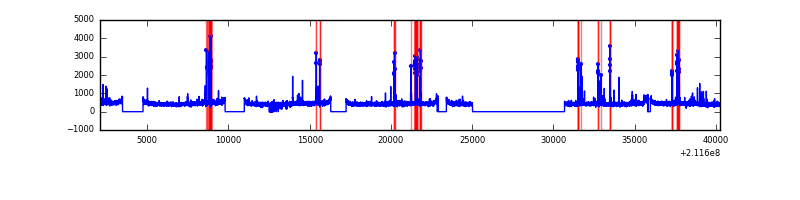 |
| B | 38158 | 28363 | 26 | 26 | 0.07% | 0.09% | 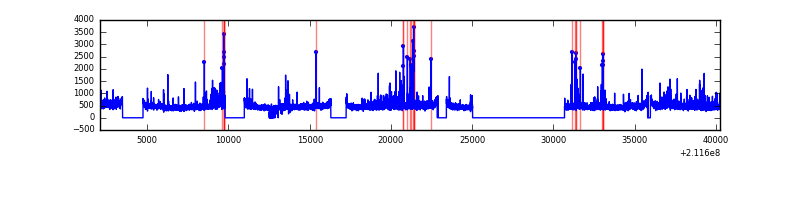 |
| C | 38158 | 28369 | 0 | 0 | 0.00% | 0.00% |  |
| D | 38157 | 28303 | 5299 | 5299 | 13.89% | 18.72% |  |
Top three noisy pixels from each quadrant. If the there are fewer than three noisy pixels in the level2.evt file, extra rows are filled as -1
| Pixel properties | Quadrant properties | ||||||
|---|---|---|---|---|---|---|---|
| Quadrant | DetID | PixID | Counts | Sigma | Mean | Median | Sigma |
| A | 0 | 50 | 613431 | 954.55 | 3195 | 3123 | 639.4 |
| A | 12 | 194 | 31982 | 45.14 | 3195 | 3123 | 639.4 |
| A | 0 | 226 | 30882 | 43.42 | 3195 | 3123 | 639.4 |
| B | 4 | 80 | 612409 | 1001.03 | 3246 | 3171 | 608.6 |
| B | 4 | 48 | 174460 | 281.44 | 3246 | 3171 | 608.6 |
| B | 0 | 219 | 133773 | 214.59 | 3246 | 3171 | 608.6 |
| C | 1 | 16 | 318496 | 447.71 | 3091 | 3096 | 704.5 |
| C | 13 | 61 | 25297 | 31.51 | 3091 | 3096 | 704.5 |
| C | 8 | 128 | 16697 | 19.31 | 3091 | 3096 | 704.5 |
| D | 11 | 145 | 19666130 | 29315.24 | 2762 | 2673 | 670.8 |
| D | 13 | 137 | 585598 | 869.05 | 2762 | 2673 | 670.8 |
| D | 2 | 63 | 315061 | 465.72 | 2762 | 2673 | 670.8 |
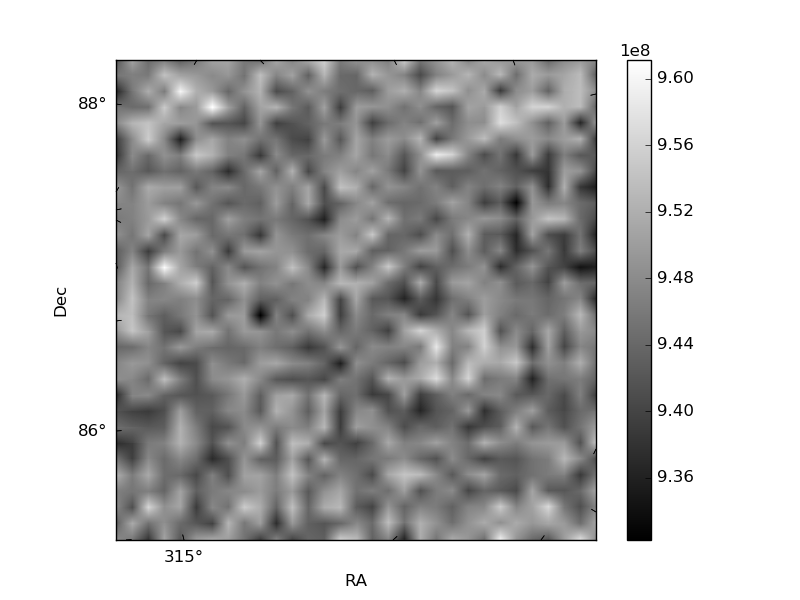
Histogram calculated using DETX and DETY for each event in the final _common_clean file
| Quadrant A | 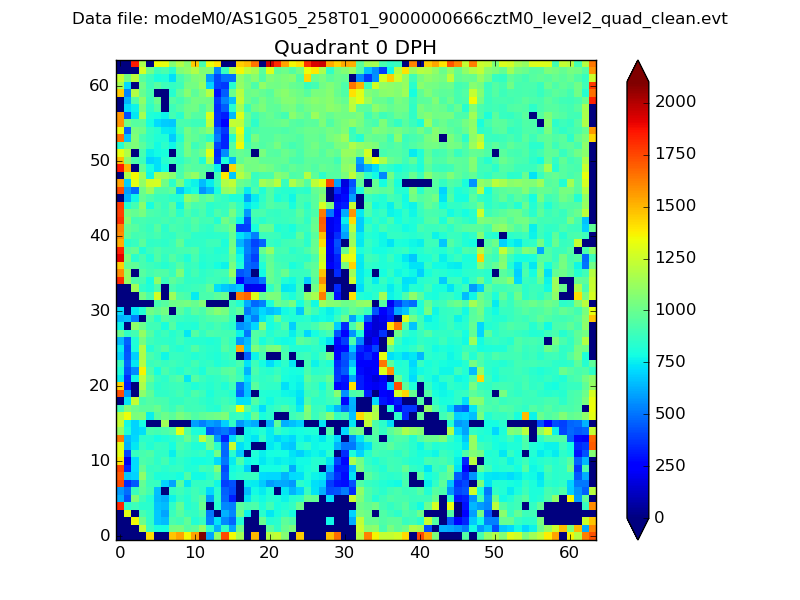 |
 |
Quadrant B |
|---|---|---|---|
| Quadrant D |  |
 |
Quadrant C |
| Plot type | Count rate plots | Images |
|---|---|---|
| Comparison with Poisson distribution Blue bars denote a histogram of data divided into 1 sec bins. Red curve is a Poisson curve with rate = median count rate of data. |
 |
 |
| Quadrant-wise count rates Data is divided into 100 sec bins |
 |
|
| Module-wise count rates for Quadrant A Data is divided into 100 sec bins |
 |
 |
| Module-wise count rates for Quadrant B Data is divided into 100 sec bins |
 |
 |
| Module-wise count rates for Quadrant C Data is divided into 100 sec bins |
 |
 |
| Module-wise count rates for Quadrant D Data is divided into 100 sec bins |
 |
 |
| Parameter | Plot |
|---|---|
| CZT HV Monitor |  |
| D_VDD |  |
| Temperature 1 |  |
| Veto HV Monitor |  |
| Veto LLD |  |
| Alpha Counter |  |
| _CPM_Rate | 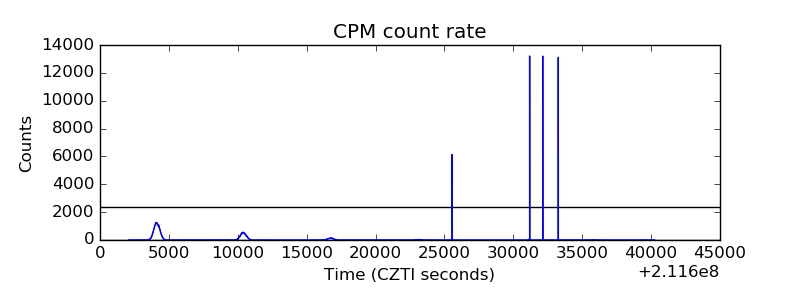 |
| CZT Counter | 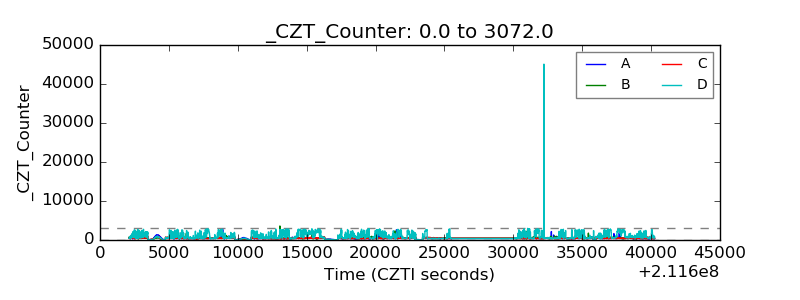 |
| +2.5 Volts monitor |  |
| +5 Volts monitor | 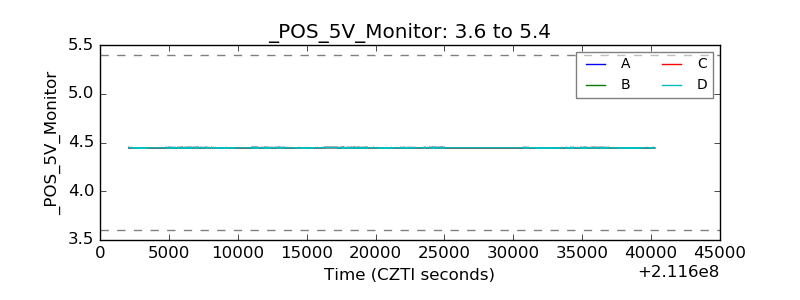 |
| _ROLL_ROT | 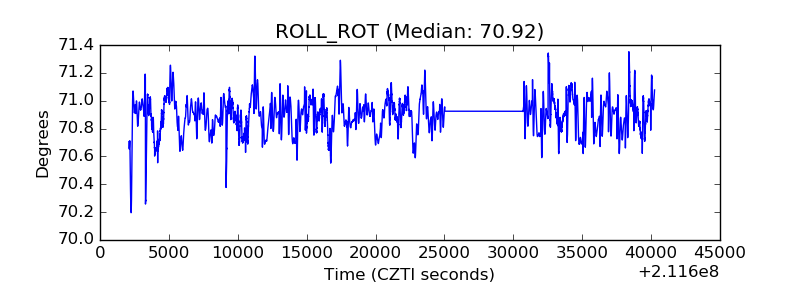 |
| _Roll_DEC | 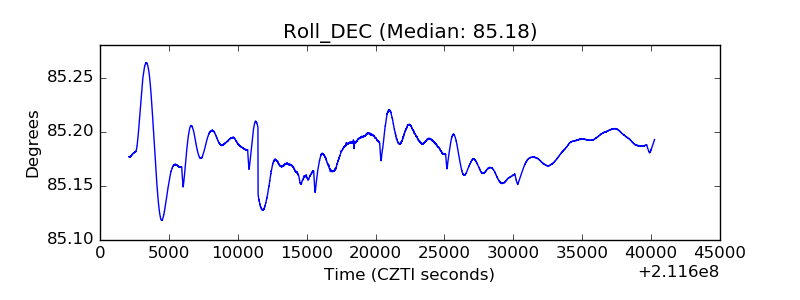 |
| _Roll_RA |  |
| Veto Counter |  |