| Param | Original file | Final file |
|---|---|---|
| Filename | modeM0/AS1C01_015T01_9000000668cztM0_level2_bc.evt | modeM0/AS1C01_015T01_9000000668cztM0_level2_quad_clean.evt |
| Size (bytes) | 3,757,213,440 | 976,354,560 |
| Size | 3.5 GB | 931.1 MB |
| Events in quadrant A | 17,783,619 | 6,017,489 |
| Events in quadrant B | 18,233,604 | 6,013,404 |
| Events in quadrant C | 18,655,784 | 5,903,648 |
| Events in quadrant D | 52,658,860 | 5,142,306 |
| Mode SS | |||
|---|---|---|---|
| Quadrant | BADHDUFLAG | Total packets | Discarded packets |
| A | 0 | 1930 | 0 |
| B | 0 | 1930 | 0 |
| C | 0 | 1930 | 0 |
| D | 0 | 1930 | 0 |
| Mode M0 | |||
|---|---|---|---|
| Quadrant | BADHDUFLAG | Total packets | Discarded packets |
| A | 0 | 194083 | 0 |
| B | 0 | 194931 | 0 |
| C | 0 | 195203 | 0 |
| D | 0 | 344848 | 0 |
| Mode M9 | |||
|---|---|---|---|
| Quadrant | BADHDUFLAG | Total packets | Discarded packets |
| A | 0 | 143 | 0 |
| B | 0 | 143 | 0 |
| C | 0 | 143 | 0 |
| D | 0 | 143 | 0 |
| Quadrant | Total seconds | Saturated seconds | Saturation percentage |
|---|---|---|---|
| A | 94685 | 1163 | 1.228283% |
| B | 94683 | 1222 | 1.290622% |
| C | 94685 | 907 | 0.957913% |
| D | 94683 | 17240 | 18.208126% |
Noise dominated data is calculated using 1-second bins in cleaned event files. If a bin has >2000 counts, and if more than 50% of those come from <1% of pixels, then it is considered to be noise-dominated and hence unusable.
| Quadrant | # 1 sec bins | Bins with >0 counts | Bins with >2000 counts | High rate bins dominated by noise | Noise dominated (total time) | Noise dominated (detector-on time) | Marked lightcurve |
|---|---|---|---|---|---|---|---|
| A | 109064 | 94690 | 4 | 4 | 0.00% | 0.00% |  |
| B | 109064 | 94689 | 2 | 2 | 0.00% | 0.00% |  |
| C | 109064 | 94692 | 7 | 7 | 0.01% | 0.01% |  |
| D | 109064 | 94675 | 1599 | 1599 | 1.47% | 1.69% |  |
Top three noisy pixels from each quadrant. If the there are fewer than three noisy pixels in the level2.evt file, extra rows are filled as -1
| Pixel properties | Quadrant properties | ||||||
|---|---|---|---|---|---|---|---|
| Quadrant | DetID | PixID | Counts | Sigma | Mean | Median | Sigma |
| A | 0 | 247 | 75715 | 70.53 | 4565 | 4457 | 1010.3 |
| A | 13 | 14 | 53147 | 48.19 | 4565 | 4457 | 1010.3 |
| A | 13 | 251 | 42155 | 37.31 | 4565 | 4457 | 1010.3 |
| B | 15 | 204 | 172057 | 189.19 | 4604 | 4461 | 885.9 |
| B | 0 | 245 | 102756 | 110.96 | 4604 | 4461 | 885.9 |
| B | 0 | 229 | 68574 | 72.37 | 4604 | 4461 | 885.9 |
| C | 1 | 16 | 657700 | 669.13 | 4456 | 4365 | 976.4 |
| C | 7 | 159 | 206635 | 207.16 | 4456 | 4365 | 976.4 |
| C | 14 | 67 | 125013 | 123.56 | 4456 | 4365 | 976.4 |
| D | 11 | 145 | 28652793 | 29767.6 | 4092 | 3919 | 962.4 |
| D | 8 | 195 | 2565763 | 2661.88 | 4092 | 3919 | 962.4 |
| D | 2 | 206 | 1101059 | 1139.98 | 4092 | 3919 | 962.4 |
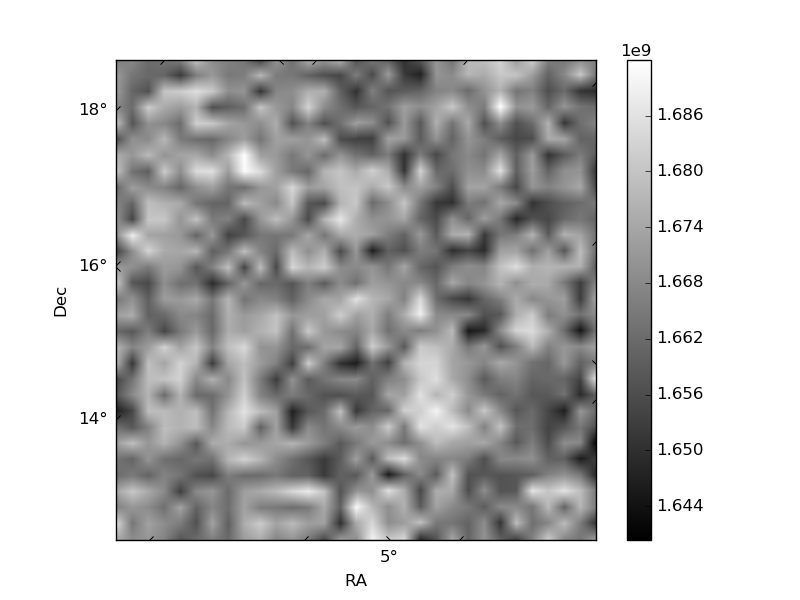
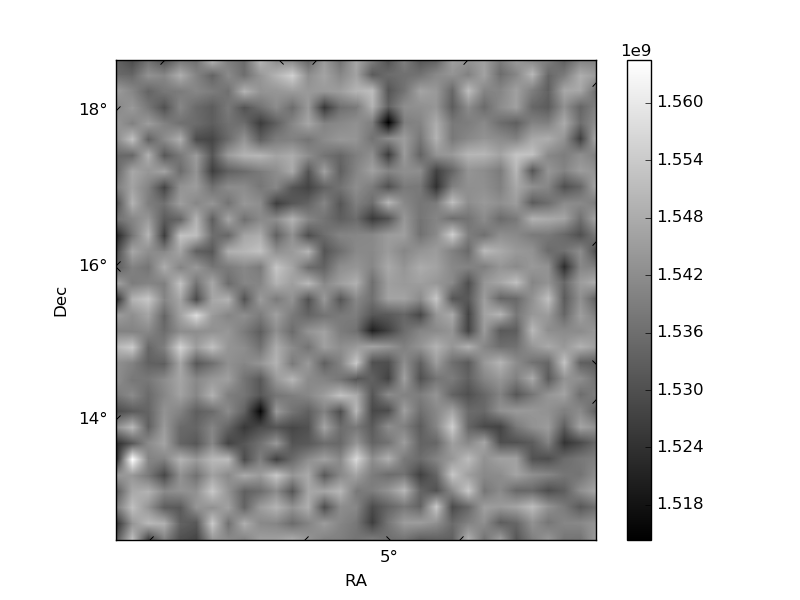
Histogram calculated using DETX and DETY for each event in the final _common_clean file
| Quadrant A |  |
 |
Quadrant B |
|---|---|---|---|
| Quadrant D |  |
 |
Quadrant C |
| Plot type | Count rate plots | Images |
|---|---|---|
| Comparison with Poisson distribution Blue bars denote a histogram of data divided into 1 sec bins. Red curve is a Poisson curve with rate = median count rate of data. |
 |
 |
| Quadrant-wise count rates Data is divided into 100 sec bins |
 |
|
| Module-wise count rates for Quadrant A Data is divided into 100 sec bins |
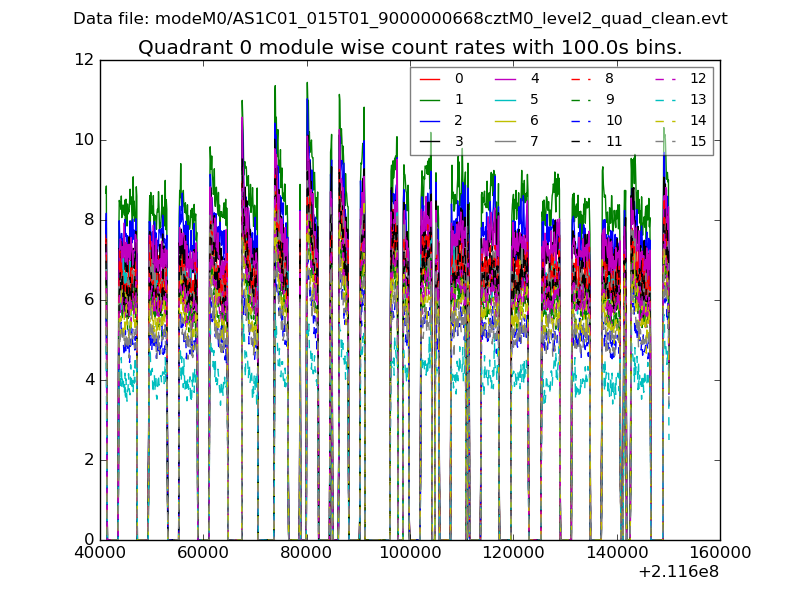 |
 |
| Module-wise count rates for Quadrant B Data is divided into 100 sec bins |
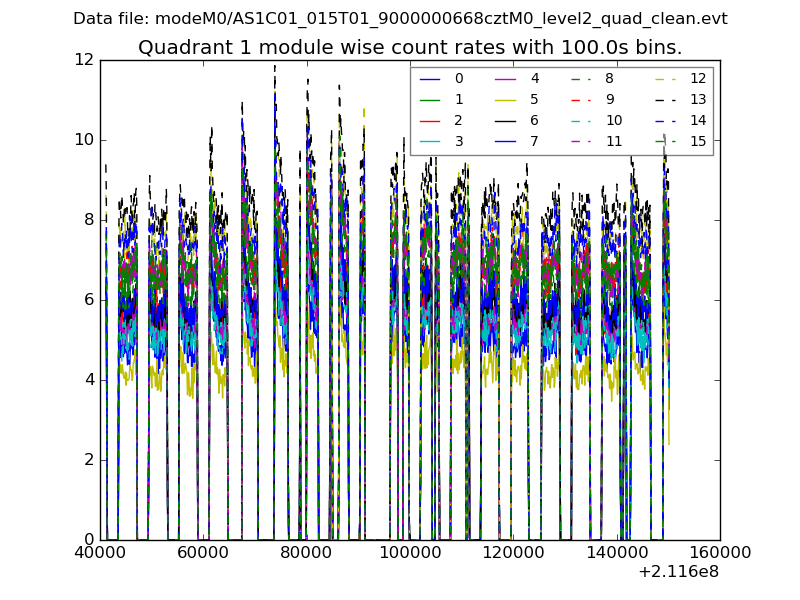 |
 |
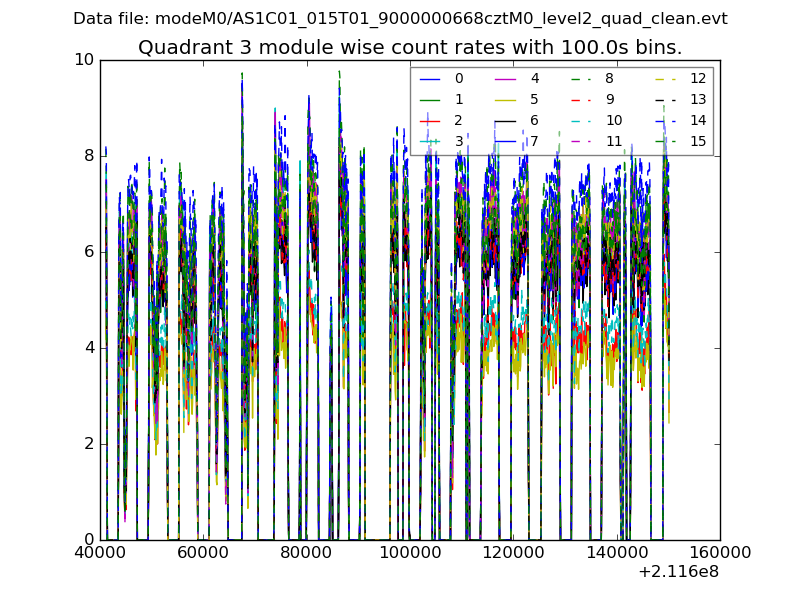
| Module-wise count rates for Quadrant C Data is divided into 100 sec bins |
 |
 |
| Module-wise count rates for Quadrant D Data is divided into 100 sec bins |
 |
 |
| Parameter | Plot |
|---|---|
| CZT HV Monitor | 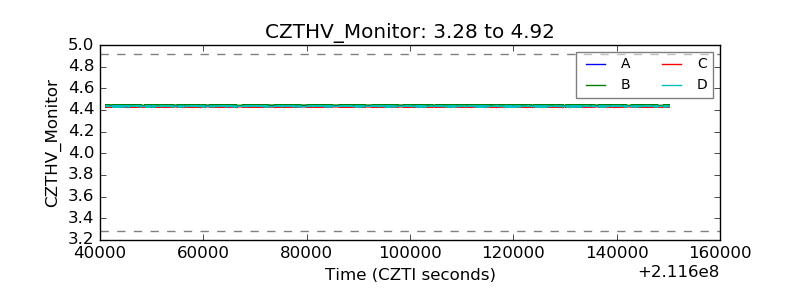 |
| D_VDD |  |
| Temperature 1 |  |
| Veto HV Monitor | 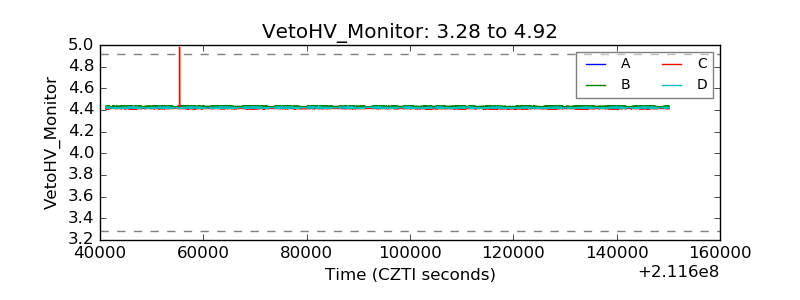 |
| Veto LLD | 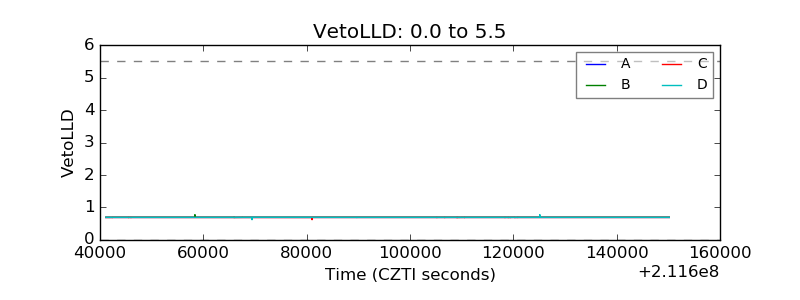 |
| Alpha Counter | 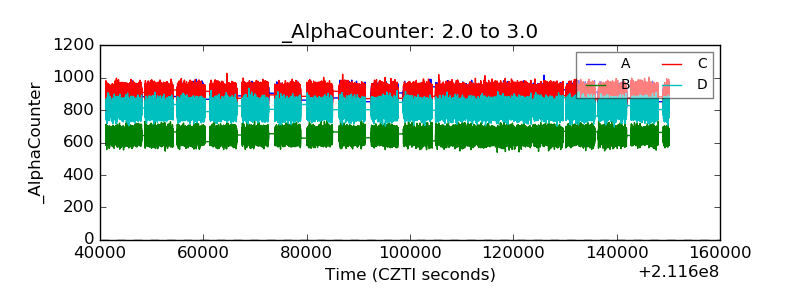 |
| _CPM_Rate |  |
| CZT Counter |  |
| +2.5 Volts monitor |  |
| +5 Volts monitor | 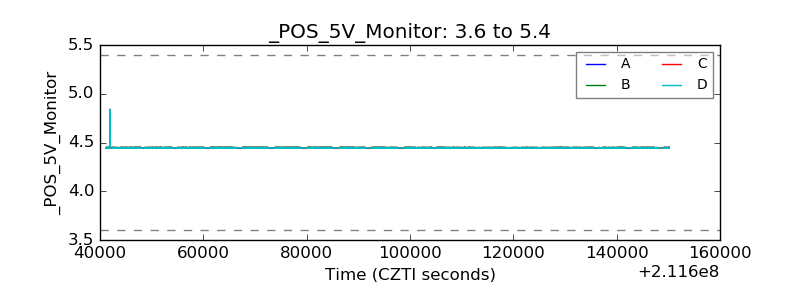 |
| _ROLL_ROT |  |
| _Roll_DEC |  |
| _Roll_RA |  |
| Veto Counter |  |