| Param | Original file | Final file |
|---|---|---|
| Filename | modeM0/AS1T01_136T01_9000000662cztM0_level2_bc.evt | modeM0/AS1T01_136T01_9000000662cztM0_level2_quad_clean.evt |
| Size (bytes) | 991,298,880 | 334,319,040 |
| Size | 945.4 MB | 318.8 MB |
| Events in quadrant A | 6,112,047 | 2,004,198 |
| Events in quadrant B | 6,544,614 | 2,033,955 |
| Events in quadrant C | 6,963,782 | 2,022,717 |
| Events in quadrant D | 8,214,952 | 1,868,143 |
| Mode M9 | |||
|---|---|---|---|
| Quadrant | BADHDUFLAG | Total packets | Discarded packets |
| A | 0 | 59 | 0 |
| B | 0 | 59 | 0 |
| C | 0 | 59 | 0 |
| D | 0 | 59 | 0 |
| Mode SS | |||
|---|---|---|---|
| Quadrant | BADHDUFLAG | Total packets | Discarded packets |
| A | 0 | 646 | 0 |
| B | 0 | 650 | 0 |
| C | 0 | 652 | 0 |
| D | 0 | 648 | 0 |
| Mode M0 | |||
|---|---|---|---|
| Quadrant | BADHDUFLAG | Total packets | Discarded packets |
| A | 0 | 65871 | 0 |
| B | 0 | 66567 | 0 |
| C | 0 | 67113 | 0 |
| D | 0 | 81886 | 0 |
| Quadrant | Total seconds | Saturated seconds | Saturation percentage |
|---|---|---|---|
| A | 31954 | 584 | 1.827627% |
| B | 31958 | 586 | 1.833657% |
| C | 31966 | 464 | 1.451542% |
| D | 31941 | 2777 | 8.694155% |
Noise dominated data is calculated using 1-second bins in cleaned event files. If a bin has >2000 counts, and if more than 50% of those come from <1% of pixels, then it is considered to be noise-dominated and hence unusable.
| Quadrant | # 1 sec bins | Bins with >0 counts | Bins with >2000 counts | High rate bins dominated by noise | Noise dominated (total time) | Noise dominated (detector-on time) | Marked lightcurve |
|---|---|---|---|---|---|---|---|
| A | 37884 | 32059 | 9 | 9 | 0.02% | 0.03% | 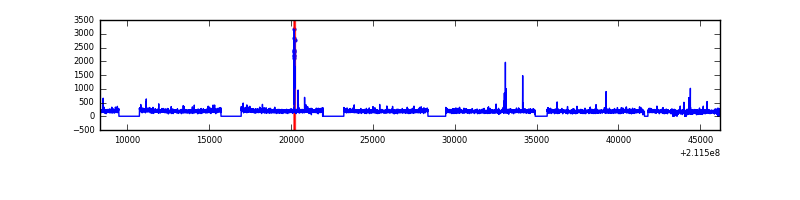 |
| B | 37884 | 32053 | 0 | 0 | 0.00% | 0.00% | 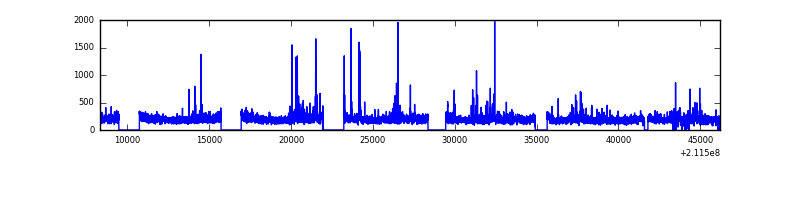 |
| C | 37884 | 32056 | 0 | 0 | 0.00% | 0.00% | 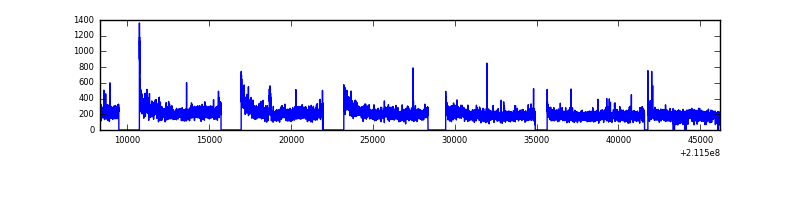 |
| D | 37884 | 32053 | 96 | 96 | 0.25% | 0.30% | 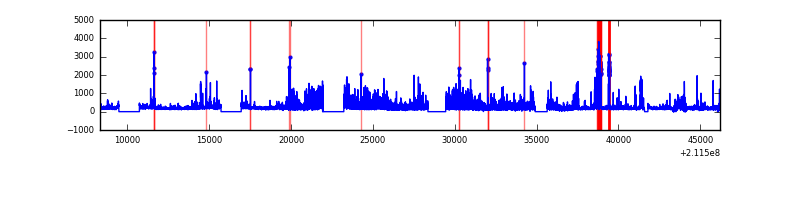 |
Top three noisy pixels from each quadrant. If the there are fewer than three noisy pixels in the level2.evt file, extra rows are filled as -1
| Pixel properties | Quadrant properties | ||||||
|---|---|---|---|---|---|---|---|
| Quadrant | DetID | PixID | Counts | Sigma | Mean | Median | Sigma |
| A | 0 | 50 | 88626 | 252.05 | 1559 | 1520 | 345.6 |
| A | 13 | 251 | 15887 | 41.57 | 1559 | 1520 | 345.6 |
| A | 12 | 194 | 13196 | 33.78 | 1559 | 1520 | 345.6 |
| B | 4 | 48 | 136748 | 447.75 | 1586 | 1541 | 302.0 |
| B | 15 | 204 | 135074 | 442.21 | 1586 | 1541 | 302.0 |
| B | 0 | 229 | 57620 | 185.71 | 1586 | 1541 | 302.0 |
| C | 1 | 16 | 783750 | 2254.0 | 1567 | 1540 | 347.0 |
| C | 12 | 4 | 19638 | 52.15 | 1567 | 1540 | 347.0 |
| C | 8 | 128 | 14785 | 38.17 | 1567 | 1540 | 347.0 |
| D | 1 | 239 | 990681 | 2809.36 | 1509 | 1449 | 352.1 |
| D | 2 | 33 | 490367 | 1388.5 | 1509 | 1449 | 352.1 |
| D | 13 | 53 | 255680 | 722.0 | 1509 | 1449 | 352.1 |
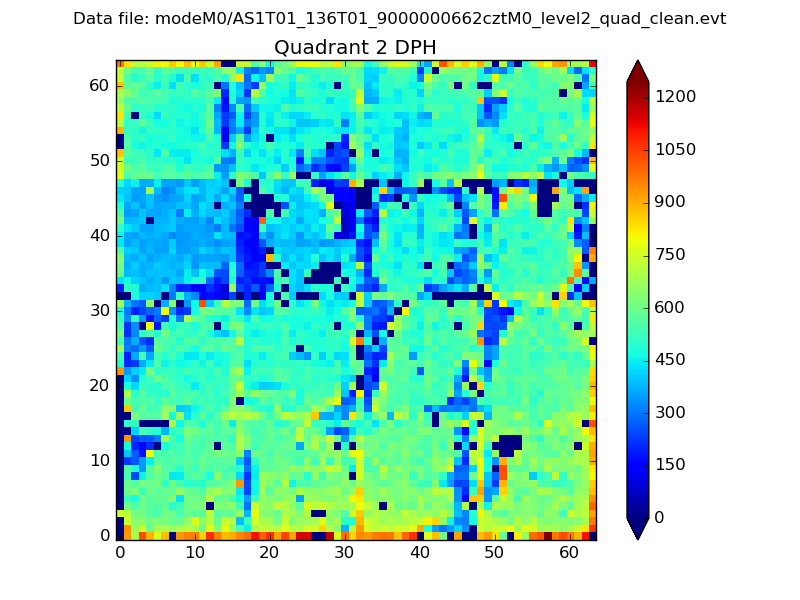
Histogram calculated using DETX and DETY for each event in the final _common_clean file
| Quadrant A |  |
 |
Quadrant B |
|---|---|---|---|
| Quadrant D | 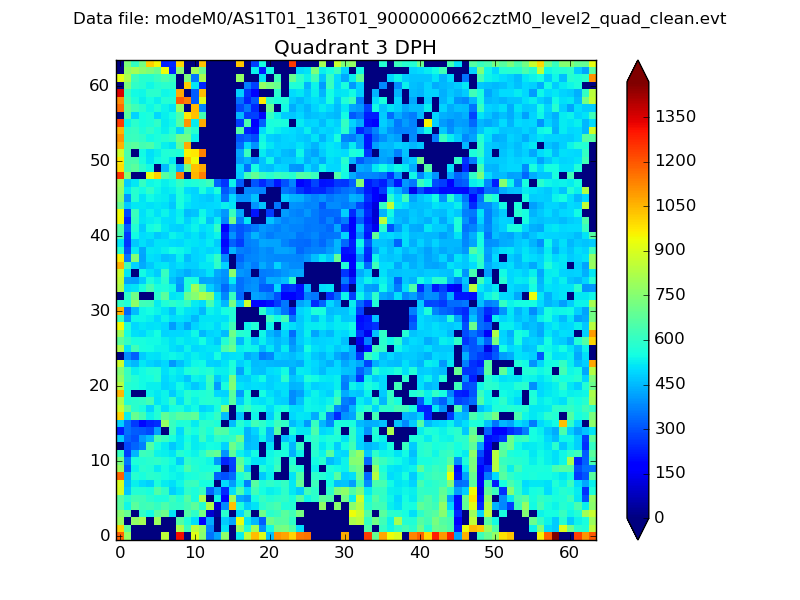 |
 |
Quadrant C |
| Plot type | Count rate plots | Images |
|---|---|---|
| Comparison with Poisson distribution Blue bars denote a histogram of data divided into 1 sec bins. Red curve is a Poisson curve with rate = median count rate of data. |
 |
 |
| Quadrant-wise count rates Data is divided into 100 sec bins |
 |
|
| Module-wise count rates for Quadrant A Data is divided into 100 sec bins |
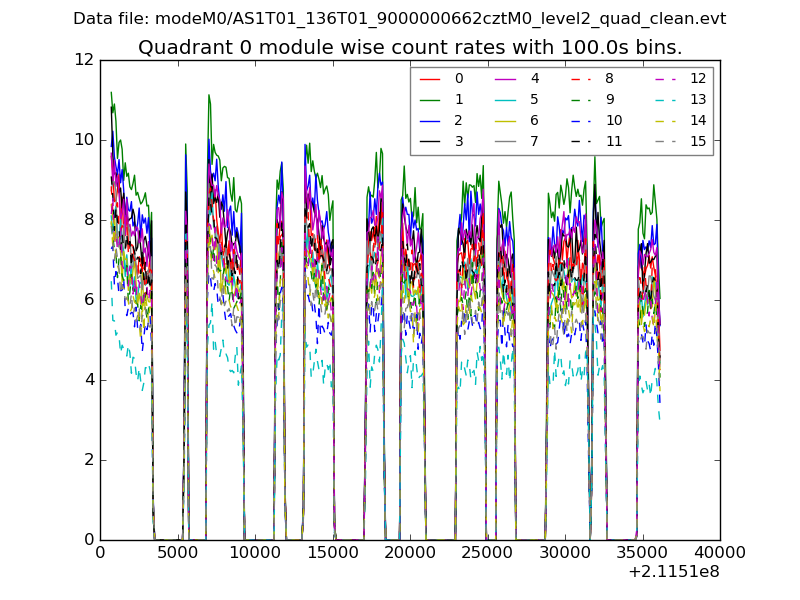 |
 |
| Module-wise count rates for Quadrant B Data is divided into 100 sec bins |
 |
 |
| Module-wise count rates for Quadrant C Data is divided into 100 sec bins |
 |
 |
| Module-wise count rates for Quadrant D Data is divided into 100 sec bins |
 |
 |
| Parameter | Plot |
|---|---|
| CZT HV Monitor |  |
| D_VDD |  |
| Temperature 1 |  |
| Veto HV Monitor |  |
| Veto LLD |  |
| Alpha Counter | 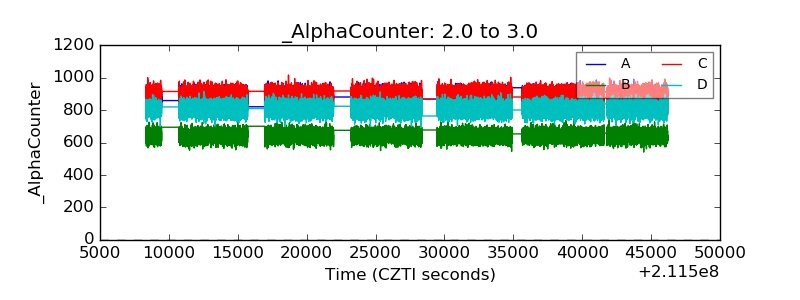 |
| _CPM_Rate |  |
| CZT Counter | 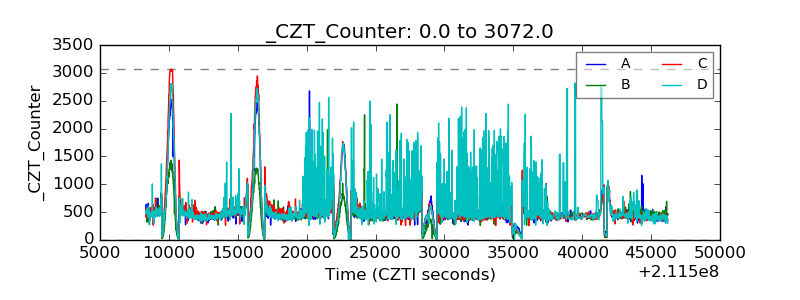 |
| +2.5 Volts monitor |  |
| +5 Volts monitor |  |
| _ROLL_ROT |  |
| _Roll_DEC | 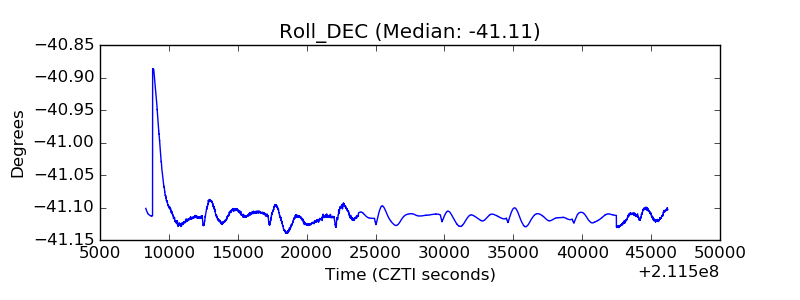 |
| _Roll_RA |  |
| Veto Counter |  |