| Param | Original file | Final file |
|---|---|---|
| Filename | modeM0/AS1G05_141T01_9000000664cztM0_level2_bc.evt | modeM0/AS1G05_141T01_9000000664cztM0_level2_quad_clean.evt |
| Size (bytes) | 1,935,717,120 | 440,078,400 |
| Size | 1.8 GB | 419.7 MB |
| Events in quadrant A | 9,454,249 | 2,649,345 |
| Events in quadrant B | 10,114,023 | 2,654,551 |
| Events in quadrant C | 9,179,554 | 2,681,214 |
| Events in quadrant D | 26,695,069 | 2,143,809 |
| Mode M0 | |||
|---|---|---|---|
| Quadrant | BADHDUFLAG | Total packets | Discarded packets |
| A | 0 | 97479 | 0 |
| B | 0 | 99372 | 0 |
| C | 0 | 95284 | 0 |
| D | 0 | 184553 | 0 |
| Mode SS | |||
|---|---|---|---|
| Quadrant | BADHDUFLAG | Total packets | Discarded packets |
| A | 0 | 942 | 0 |
| B | 0 | 944 | 0 |
| C | 0 | 946 | 0 |
| D | 0 | 948 | 0 |
| Mode M9 | |||
|---|---|---|---|
| Quadrant | BADHDUFLAG | Total packets | Discarded packets |
| A | 0 | 71 | 0 |
| B | 0 | 71 | 0 |
| C | 0 | 71 | 0 |
| D | 0 | 71 | 0 |
| Quadrant | Total seconds | Saturated seconds | Saturation percentage |
|---|---|---|---|
| A | 46575 | 661 | 1.419216% |
| B | 46590 | 695 | 1.491736% |
| C | 46568 | 263 | 0.564766% |
| D | 46571 | 11566 | 24.835198% |
Noise dominated data is calculated using 1-second bins in cleaned event files. If a bin has >2000 counts, and if more than 50% of those come from <1% of pixels, then it is considered to be noise-dominated and hence unusable.
| Quadrant | # 1 sec bins | Bins with >0 counts | Bins with >2000 counts | High rate bins dominated by noise | Noise dominated (total time) | Noise dominated (detector-on time) | Marked lightcurve |
|---|---|---|---|---|---|---|---|
| A | 53593 | 46649 | 35 | 35 | 0.07% | 0.08% | 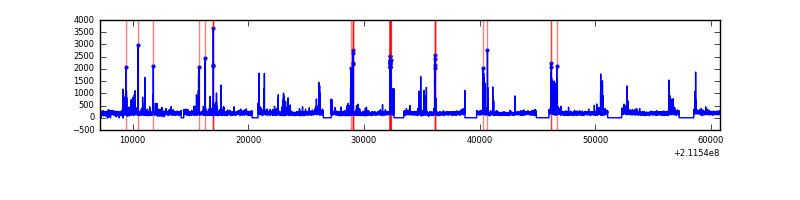 |
| B | 53593 | 46656 | 25 | 25 | 0.05% | 0.05% |  |
| C | 53593 | 46654 | 1 | 1 | 0.00% | 0.00% |  |
| D | 53593 | 46639 | 868 | 868 | 1.62% | 1.86% |  |
Top three noisy pixels from each quadrant. If the there are fewer than three noisy pixels in the level2.evt file, extra rows are filled as -1
| Pixel properties | Quadrant properties | ||||||
|---|---|---|---|---|---|---|---|
| Quadrant | DetID | PixID | Counts | Sigma | Mean | Median | Sigma |
| A | 0 | 50 | 734074 | 1468.3 | 2244 | 2192 | 498.5 |
| A | 4 | 2 | 31032 | 57.86 | 2244 | 2192 | 498.5 |
| A | 13 | 251 | 29778 | 55.34 | 2244 | 2192 | 498.5 |
| B | 4 | 80 | 259802 | 590.06 | 2276 | 2210 | 436.6 |
| B | 15 | 204 | 248499 | 564.17 | 2276 | 2210 | 436.6 |
| B | 5 | 172 | 175618 | 397.22 | 2276 | 2210 | 436.6 |
| C | 1 | 16 | 386099 | 780.35 | 2218 | 2176 | 492.0 |
| C | 12 | 4 | 35705 | 68.15 | 2218 | 2176 | 492.0 |
| C | 8 | 128 | 34282 | 65.26 | 2218 | 2176 | 492.0 |
| D | 11 | 145 | 17255234 | 38061.07 | 1909 | 1828 | 453.3 |
| D | 2 | 33 | 903052 | 1988.1 | 1909 | 1828 | 453.3 |
| D | 12 | 233 | 462148 | 1015.47 | 1909 | 1828 | 453.3 |
Histogram calculated using DETX and DETY for each event in the final _common_clean file
| Quadrant A |  |
 |
Quadrant B |
|---|---|---|---|
| Quadrant D | 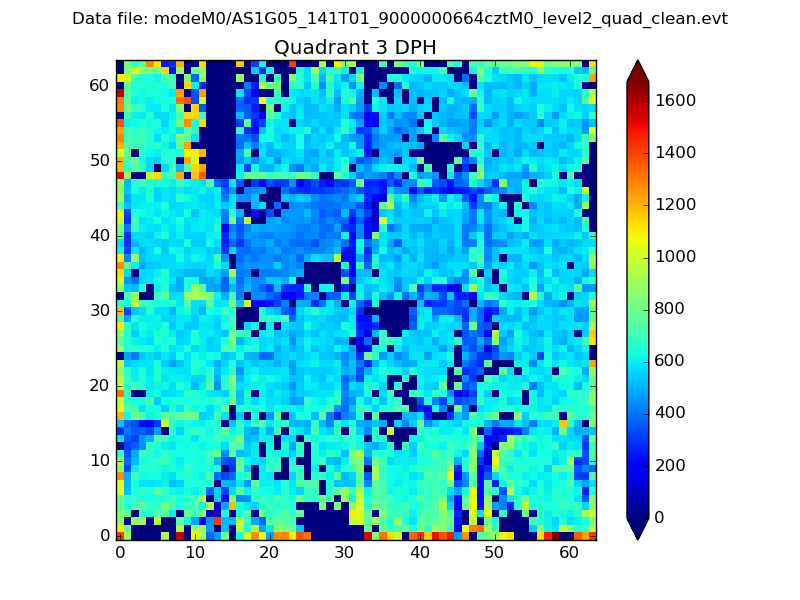 |
 |
Quadrant C |
| Plot type | Count rate plots | Images |
|---|---|---|
| Comparison with Poisson distribution Blue bars denote a histogram of data divided into 1 sec bins. Red curve is a Poisson curve with rate = median count rate of data. |
 |
 |
| Quadrant-wise count rates Data is divided into 100 sec bins |
 |
|
| Module-wise count rates for Quadrant A Data is divided into 100 sec bins |
 |
 |
| Module-wise count rates for Quadrant B Data is divided into 100 sec bins |
 |
 |
| Module-wise count rates for Quadrant C Data is divided into 100 sec bins |
 |
 |
| Module-wise count rates for Quadrant D Data is divided into 100 sec bins |
 |
 |
| Parameter | Plot |
|---|---|
| CZT HV Monitor |  |
| D_VDD |  |
| Temperature 1 |  |
| Veto HV Monitor |  |
| Veto LLD |  |
| Alpha Counter |  |
| _CPM_Rate |  |
| CZT Counter |  |
| +2.5 Volts monitor |  |
| +5 Volts monitor |  |
| _ROLL_ROT |  |
| _Roll_DEC |  |
| _Roll_RA |  |
| Veto Counter | 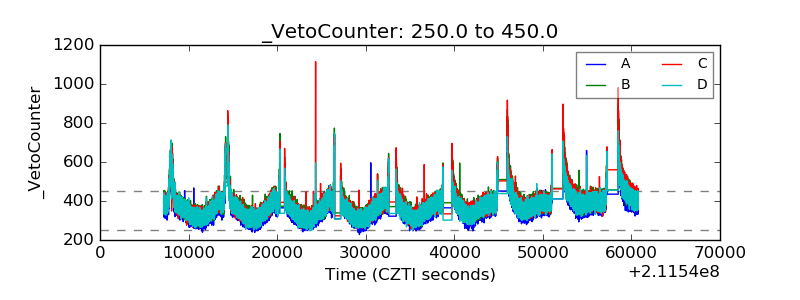 |