| Param | Original file | Final file |
|---|---|---|
| Filename | modeM0/AS1G05_194T01_9000000660cztM0_level2_bc.evt | modeM0/AS1G05_194T01_9000000660cztM0_level2_quad_clean.evt |
| Size (bytes) | 466,920,000 | 145,166,400 |
| Size | 445.3 MB | 138.4 MB |
| Events in quadrant A | 2,950,349 | 838,141 |
| Events in quadrant B | 3,014,701 | 857,143 |
| Events in quadrant C | 3,491,961 | 854,232 |
| Events in quadrant D | 3,650,043 | 807,350 |
| Mode M9 | |||
|---|---|---|---|
| Quadrant | BADHDUFLAG | Total packets | Discarded packets |
| A | 0 | 31 | 0 |
| B | 0 | 31 | 0 |
| C | 0 | 31 | 0 |
| D | 0 | 31 | 0 |
| Mode SS | |||
|---|---|---|---|
| Quadrant | BADHDUFLAG | Total packets | Discarded packets |
| A | 0 | 310 | 0 |
| B | 0 | 310 | 0 |
| C | 0 | 310 | 0 |
| D | 0 | 310 | 0 |
| Mode M0 | |||
|---|---|---|---|
| Quadrant | BADHDUFLAG | Total packets | Discarded packets |
| A | 0 | 31057 | 0 |
| B | 0 | 31011 | 0 |
| C | 0 | 31993 | 0 |
| D | 0 | 33424 | 0 |
| Quadrant | Total seconds | Saturated seconds | Saturation percentage |
|---|---|---|---|
| A | 15052 | 120 | 0.797236% |
| B | 15047 | 98 | 0.651293% |
| C | 15045 | 60 | 0.398804% |
| D | 15051 | 184 | 1.222510% |
Noise dominated data is calculated using 1-second bins in cleaned event files. If a bin has >2000 counts, and if more than 50% of those come from <1% of pixels, then it is considered to be noise-dominated and hence unusable.
| Quadrant | # 1 sec bins | Bins with >0 counts | Bins with >2000 counts | High rate bins dominated by noise | Noise dominated (total time) | Noise dominated (detector-on time) | Marked lightcurve |
|---|---|---|---|---|---|---|---|
| A | 18219 | 15059 | 5 | 5 | 0.03% | 0.03% |  |
| B | 18219 | 15058 | 0 | 0 | 0.00% | 0.00% |  |
| C | 18219 | 15059 | 0 | 0 | 0.00% | 0.00% |  |
| D | 18219 | 15059 | 20 | 20 | 0.11% | 0.13% |  |
Top three noisy pixels from each quadrant. If the there are fewer than three noisy pixels in the level2.evt file, extra rows are filled as -1
| Pixel properties | Quadrant properties | ||||||
|---|---|---|---|---|---|---|---|
| Quadrant | DetID | PixID | Counts | Sigma | Mean | Median | Sigma |
| A | 0 | 50 | 128401 | 787.35 | 727 | 708 | 162.2 |
| A | 13 | 14 | 13467 | 78.67 | 727 | 708 | 162.2 |
| A | 14 | 111 | 8675 | 49.12 | 727 | 708 | 162.2 |
| B | 15 | 204 | 57381 | 395.78 | 742 | 721 | 143.2 |
| B | 0 | 219 | 27392 | 186.3 | 742 | 721 | 143.2 |
| B | 8 | 3 | 23945 | 162.22 | 742 | 721 | 143.2 |
| C | 1 | 16 | 626368 | 3813.6 | 727 | 713 | 164.1 |
| C | 14 | 67 | 10620 | 60.39 | 727 | 713 | 164.1 |
| C | 12 | 4 | 7469 | 41.18 | 727 | 713 | 164.1 |
| D | 2 | 136 | 316830 | 1874.78 | 719 | 691 | 168.6 |
| D | 2 | 33 | 260881 | 1542.99 | 719 | 691 | 168.6 |
| D | 2 | 206 | 74325 | 436.67 | 719 | 691 | 168.6 |
Histogram calculated using DETX and DETY for each event in the final _common_clean file
| Quadrant A |  |
 |
Quadrant B |
|---|---|---|---|
| Quadrant D |  |
 |
Quadrant C |
| Plot type | Count rate plots | Images |
|---|---|---|
| Comparison with Poisson distribution Blue bars denote a histogram of data divided into 1 sec bins. Red curve is a Poisson curve with rate = median count rate of data. |
 |
 |
| Quadrant-wise count rates Data is divided into 100 sec bins |
 |
|
| Module-wise count rates for Quadrant A Data is divided into 100 sec bins |
 |
 |
| Module-wise count rates for Quadrant B Data is divided into 100 sec bins |
 |
 |
| Module-wise count rates for Quadrant C Data is divided into 100 sec bins |
 |
 |
| Module-wise count rates for Quadrant D Data is divided into 100 sec bins |
 |
 |
| Parameter | Plot |
|---|---|
| CZT HV Monitor |  |
| D_VDD |  |
| Temperature 1 |  |
| Veto HV Monitor | 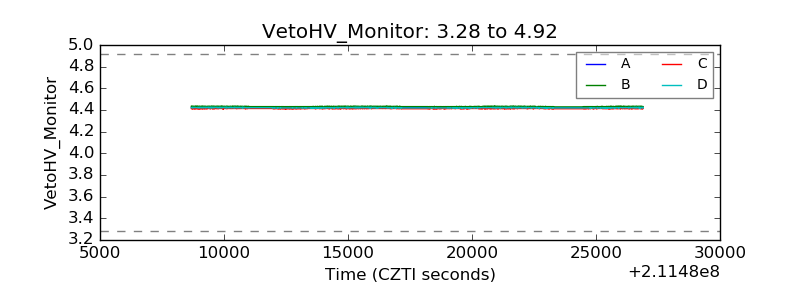 |
| Veto LLD |  |
| Alpha Counter |  |
| _CPM_Rate |  |
| CZT Counter |  |
| +2.5 Volts monitor |  |
| +5 Volts monitor |  |
| _ROLL_ROT |  |
| _Roll_DEC |  |
| _Roll_RA |  |
| Veto Counter |  |