| Param | Original file | Final file |
|---|---|---|
| Filename | modeM0/AS1G05_152T02_9000000658cztM0_level2_bc.evt | modeM0/AS1G05_152T02_9000000658cztM0_level2_quad_clean.evt |
| Size (bytes) | 576,057,600 | 229,478,400 |
| Size | 549.4 MB | 218.8 MB |
| Events in quadrant A | 4,047,792 | 1,394,097 |
| Events in quadrant B | 4,016,340 | 1,398,914 |
| Events in quadrant C | 3,820,825 | 1,394,967 |
| Events in quadrant D | 4,162,305 | 1,358,333 |
| Mode SS | |||
|---|---|---|---|
| Quadrant | BADHDUFLAG | Total packets | Discarded packets |
| A | 0 | 454 | 0 |
| B | 0 | 448 | 0 |
| C | 0 | 459 | 0 |
| D | 0 | 426 | 0 |
| Mode M9 | |||
|---|---|---|---|
| Quadrant | BADHDUFLAG | Total packets | Discarded packets |
| A | 1 | 251318637792 | 0 |
| B | 1 | 251318637792 | 0 |
| C | 1 | 251318637792 | 0 |
| D | 1 | 251318637792 | 0 |
| Mode M0 | |||
|---|---|---|---|
| Quadrant | BADHDUFLAG | Total packets | Discarded packets |
| A | 0 | 42281 | 0 |
| B | 0 | 41898 | 0 |
| C | 0 | 41428 | 0 |
| D | 0 | 42833 | 0 |
| Quadrant | Total seconds | Saturated seconds | Saturation percentage |
|---|---|---|---|
| A | 20283 | 327 | 1.612188% |
| B | 20287 | 295 | 1.454133% |
| C | 20254 | 209 | 1.031895% |
| D | 20254 | 318 | 1.570060% |
Noise dominated data is calculated using 1-second bins in cleaned event files. If a bin has >2000 counts, and if more than 50% of those come from <1% of pixels, then it is considered to be noise-dominated and hence unusable.
| Quadrant | # 1 sec bins | Bins with >0 counts | Bins with >2000 counts | High rate bins dominated by noise | Noise dominated (total time) | Noise dominated (detector-on time) | Marked lightcurve |
|---|---|---|---|---|---|---|---|
| A | 28090 | 21154 | 14 | 14 | 0.05% | 0.07% |  |
| B | 28090 | 21137 | 0 | 0 | 0.00% | 0.00% |  |
| C | 28088 | 21110 | 0 | 0 | 0.00% | 0.00% |  |
| D | 28090 | 21123 | 74 | 74 | 0.26% | 0.35% |  |
Top three noisy pixels from each quadrant. If the there are fewer than three noisy pixels in the level2.evt file, extra rows are filled as -1
| Pixel properties | Quadrant properties | ||||||
|---|---|---|---|---|---|---|---|
| Quadrant | DetID | PixID | Counts | Sigma | Mean | Median | Sigma |
| A | 4 | 2 | 341447 | 1600.43 | 936 | 912 | 212.8 |
| A | 0 | 50 | 55027 | 254.33 | 936 | 912 | 212.8 |
| A | 13 | 14 | 39139 | 179.66 | 936 | 912 | 212.8 |
| B | 15 | 204 | 232232 | 1241.99 | 951 | 921 | 186.2 |
| B | 4 | 48 | 70817 | 375.3 | 951 | 921 | 186.2 |
| B | 0 | 229 | 26869 | 139.32 | 951 | 921 | 186.2 |
| C | 1 | 16 | 99991 | 475.07 | 929 | 913 | 208.6 |
| C | 8 | 128 | 23337 | 107.52 | 929 | 913 | 208.6 |
| C | 5 | 250 | 21490 | 98.67 | 929 | 913 | 208.6 |
| D | 2 | 63 | 210284 | 939.65 | 931 | 892 | 222.8 |
| D | 2 | 136 | 203442 | 908.95 | 931 | 892 | 222.8 |
| D | 2 | 33 | 108912 | 484.74 | 931 | 892 | 222.8 |
Histogram calculated using DETX and DETY for each event in the final _common_clean file
| Quadrant A |  |
 |
Quadrant B |
|---|---|---|---|
| Quadrant D | 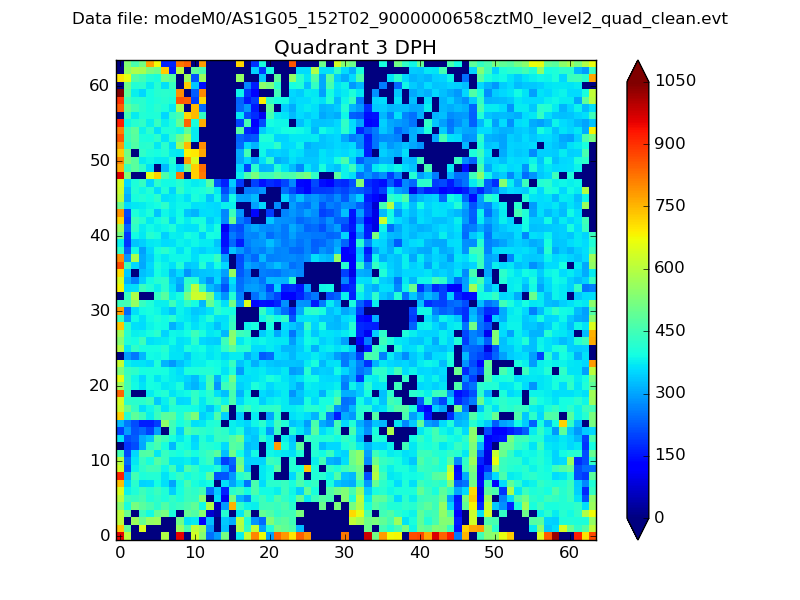 |
 |
Quadrant C |
| Plot type | Count rate plots | Images |
|---|---|---|
| Comparison with Poisson distribution Blue bars denote a histogram of data divided into 1 sec bins. Red curve is a Poisson curve with rate = median count rate of data. |
 |
 |
| Quadrant-wise count rates Data is divided into 100 sec bins |
 |
|
| Module-wise count rates for Quadrant A Data is divided into 100 sec bins |
 |
 |
| Module-wise count rates for Quadrant B Data is divided into 100 sec bins |
 |
 |
| Module-wise count rates for Quadrant C Data is divided into 100 sec bins |
 |
 |
| Module-wise count rates for Quadrant D Data is divided into 100 sec bins |
 |
 |
| Parameter | Plot |
|---|---|
| CZT HV Monitor |  |
| D_VDD |  |
| Temperature 1 |  |
| Veto HV Monitor |  |
| Veto LLD |  |
| Alpha Counter |  |
| _CPM_Rate |  |
| CZT Counter |  |
| +2.5 Volts monitor |  |
| +5 Volts monitor |  |
| _ROLL_ROT |  |
| _Roll_DEC |  |
| _Roll_RA |  |
| Veto Counter | 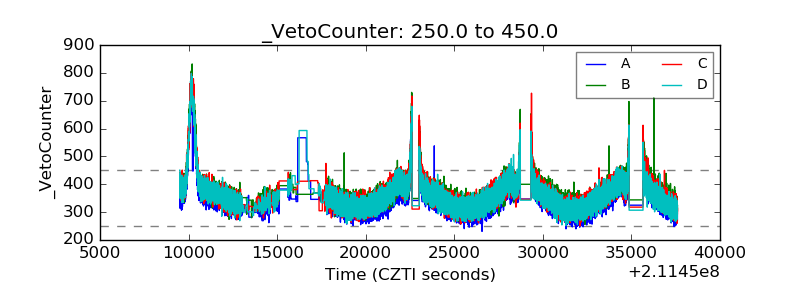 |