| Param | Original file | Final file |
|---|---|---|
| Filename | modeM0/AS1G05_243T01_9000000654cztM0_level2_bc.evt | modeM0/AS1G05_243T01_9000000654cztM0_level2_quad_clean.evt |
| Size (bytes) | 332,265,600 | 96,698,880 |
| Size | 316.9 MB | 92.2 MB |
| Events in quadrant A | 1,909,546 | 571,378 |
| Events in quadrant B | 2,085,440 | 572,055 |
| Events in quadrant C | 1,865,547 | 578,026 |
| Events in quadrant D | 3,532,049 | 533,542 |
| Mode M9 | |||
|---|---|---|---|
| Quadrant | BADHDUFLAG | Total packets | Discarded packets |
| A | 0 | 4 | 0 |
| B | 0 | 4 | 0 |
| C | 0 | 4 | 0 |
| D | 0 | 4 | 0 |
| Mode M0 | |||
|---|---|---|---|
| Quadrant | BADHDUFLAG | Total packets | Discarded packets |
| A | 0 | 20569 | 0 |
| B | 0 | 21087 | 0 |
| C | 0 | 20338 | 0 |
| D | 0 | 25594 | 0 |
| Mode SS | |||
|---|---|---|---|
| Quadrant | BADHDUFLAG | Total packets | Discarded packets |
| A | 0 | 198 | 0 |
| B | 0 | 198 | 0 |
| C | 0 | 198 | 0 |
| D | 0 | 198 | 0 |
| Quadrant | Total seconds | Saturated seconds | Saturation percentage |
|---|---|---|---|
| A | 9710 | 493 | 5.077240% |
| B | 9711 | 505 | 5.200288% |
| C | 9711 | 273 | 2.811245% |
| D | 9711 | 693 | 7.136237% |
Noise dominated data is calculated using 1-second bins in cleaned event files. If a bin has >2000 counts, and if more than 50% of those come from <1% of pixels, then it is considered to be noise-dominated and hence unusable.
| Quadrant | # 1 sec bins | Bins with >0 counts | Bins with >2000 counts | High rate bins dominated by noise | Noise dominated (total time) | Noise dominated (detector-on time) | Marked lightcurve |
|---|---|---|---|---|---|---|---|
| A | 10076 | 9711 | 2 | 2 | 0.02% | 0.02% |  |
| B | 10076 | 9711 | 1 | 1 | 0.01% | 0.01% |  |
| C | 10076 | 9711 | 0 | 0 | 0.00% | 0.00% | 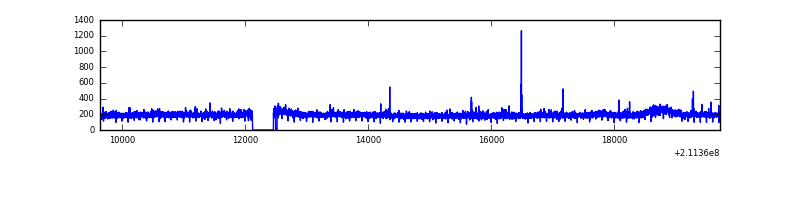 |
| D | 10076 | 9711 | 156 | 156 | 1.55% | 1.61% | 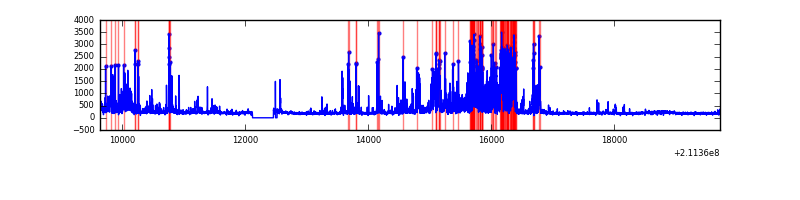 |
Top three noisy pixels from each quadrant. If the there are fewer than three noisy pixels in the level2.evt file, extra rows are filled as -1
| Pixel properties | Quadrant properties | ||||||
|---|---|---|---|---|---|---|---|
| Quadrant | DetID | PixID | Counts | Sigma | Mean | Median | Sigma |
| A | 0 | 247 | 67315 | 629.69 | 465 | 452 | 106.2 |
| A | 0 | 50 | 38717 | 360.36 | 465 | 452 | 106.2 |
| A | 0 | 226 | 9286 | 83.19 | 465 | 452 | 106.2 |
| B | 4 | 80 | 118607 | 1264.23 | 474 | 459 | 93.5 |
| B | 15 | 204 | 77103 | 820.12 | 474 | 459 | 93.5 |
| B | 4 | 48 | 20670 | 216.27 | 474 | 459 | 93.5 |
| C | 1 | 16 | 16286 | 149.8 | 467 | 458 | 105.7 |
| C | 8 | 128 | 7914 | 70.57 | 467 | 458 | 105.7 |
| C | 12 | 4 | 6226 | 54.59 | 467 | 458 | 105.7 |
| D | 14 | 34 | 844054 | 7675.1 | 459 | 439 | 109.9 |
| D | 2 | 136 | 525506 | 4776.99 | 459 | 439 | 109.9 |
| D | 2 | 33 | 133015 | 1206.16 | 459 | 439 | 109.9 |
Histogram calculated using DETX and DETY for each event in the final _common_clean file
| Quadrant A | 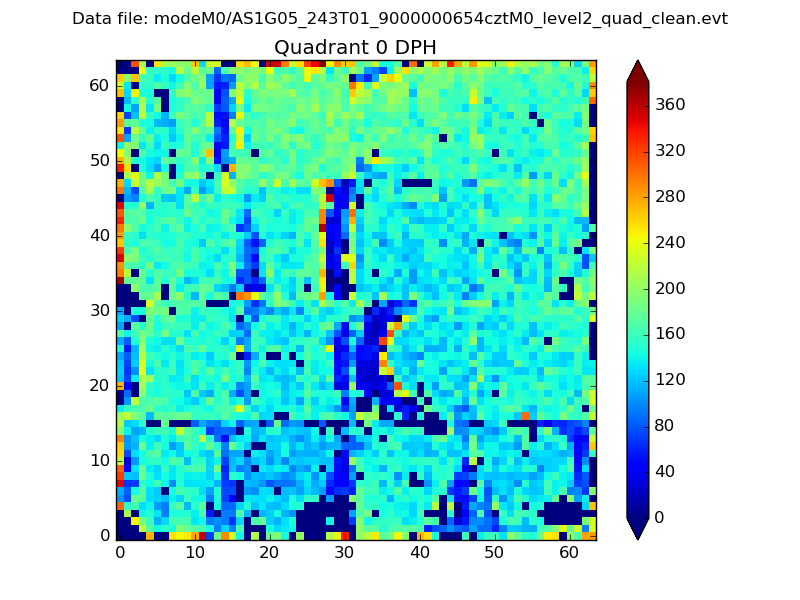 |
 |
Quadrant B |
|---|---|---|---|
| Quadrant D |  |
 |
Quadrant C |
| Plot type | Count rate plots | Images |
|---|---|---|
| Comparison with Poisson distribution Blue bars denote a histogram of data divided into 1 sec bins. Red curve is a Poisson curve with rate = median count rate of data. |
 |
 |
| Quadrant-wise count rates Data is divided into 100 sec bins |
 |
|
| Module-wise count rates for Quadrant A Data is divided into 100 sec bins |
 |
 |
| Module-wise count rates for Quadrant B Data is divided into 100 sec bins |
 |
 |
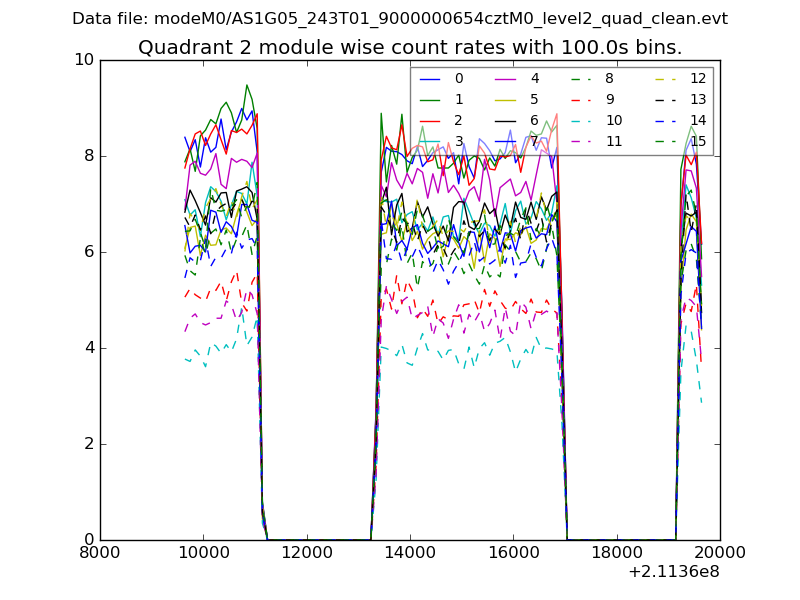
| Module-wise count rates for Quadrant C Data is divided into 100 sec bins |
 |
 |
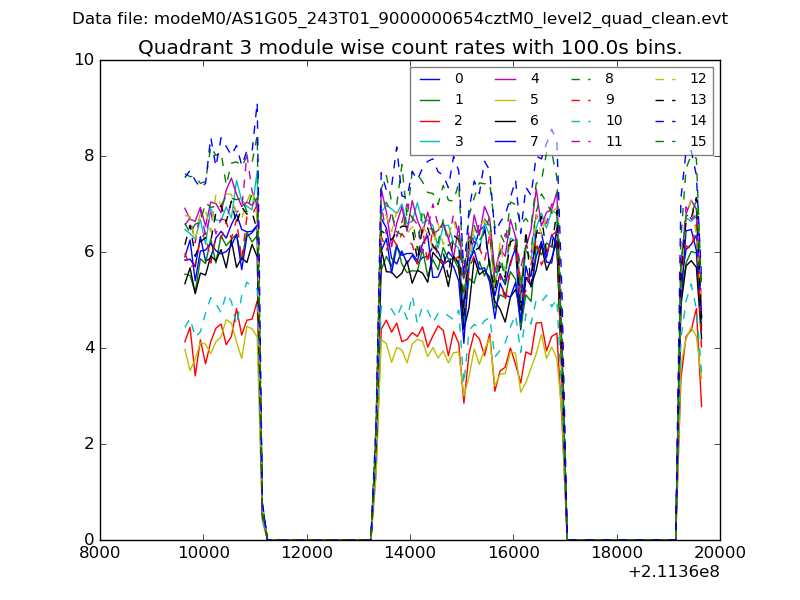
| Module-wise count rates for Quadrant D Data is divided into 100 sec bins |
 |
 |
| Parameter | Plot |
|---|---|
| CZT HV Monitor |  |
| D_VDD |  |
| Temperature 1 |  |
| Veto HV Monitor |  |
| Veto LLD |  |
| Alpha Counter |  |
| _CPM_Rate |  |
| CZT Counter |  |
| +2.5 Volts monitor |  |
| +5 Volts monitor |  |
| _ROLL_ROT | 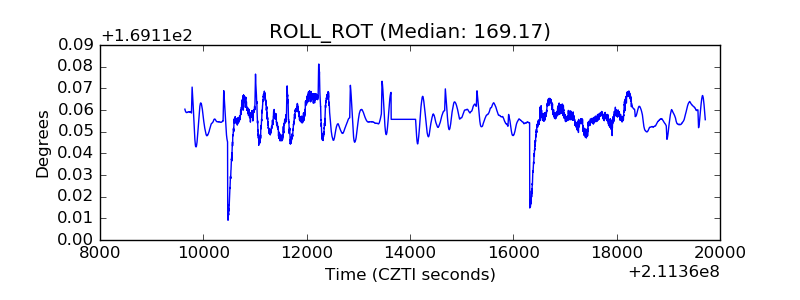 |
| _Roll_DEC | 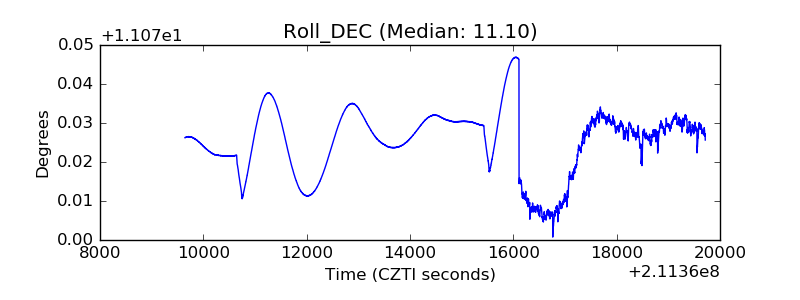 |
| _Roll_RA | 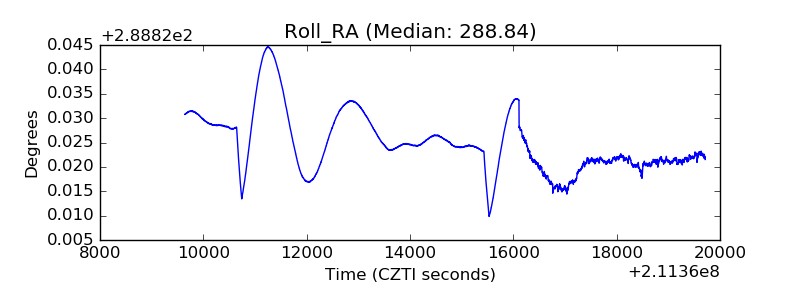 |
| Veto Counter |  |