| Param | Original file | Final file |
|---|---|---|
| Filename | modeM0/AS1G05_104T01_9000000656cztM0_level2_bc.evt | modeM0/AS1G05_104T01_9000000656cztM0_level2_quad_clean.evt |
| Size (bytes) | 2,186,864,640 | 862,145,280 |
| Size | 2.0 GB | 822.2 MB |
| Events in quadrant A | 13,408,040 | 5,452,873 |
| Events in quadrant B | 13,813,540 | 5,498,253 |
| Events in quadrant C | 12,885,064 | 5,526,577 |
| Events in quadrant D | 21,699,942 | 5,188,710 |
| Mode SS | |||
|---|---|---|---|
| Quadrant | BADHDUFLAG | Total packets | Discarded packets |
| A | 0 | 1328 | 0 |
| B | 0 | 1320 | 0 |
| C | 0 | 1330 | 0 |
| D | 0 | 1326 | 0 |
| Mode M9 | |||
|---|---|---|---|
| Quadrant | BADHDUFLAG | Total packets | Discarded packets |
| A | 0 | 108 | 0 |
| B | 0 | 108 | 0 |
| C | 0 | 108 | 0 |
| D | 0 | 108 | 0 |
| Mode M0 | |||
|---|---|---|---|
| Quadrant | BADHDUFLAG | Total packets | Discarded packets |
| A | 0 | 134917 | 0 |
| B | 0 | 135164 | 0 |
| C | 0 | 132245 | 0 |
| D | 0 | 163805 | 0 |
| Quadrant | Total seconds | Saturated seconds | Saturation percentage |
|---|---|---|---|
| A | 64882 | 812 | 1.251503% |
| B | 64846 | 665 | 1.025507% |
| C | 64871 | 394 | 0.607359% |
| D | 64714 | 2824 | 4.363816% |
Noise dominated data is calculated using 1-second bins in cleaned event files. If a bin has >2000 counts, and if more than 50% of those come from <1% of pixels, then it is considered to be noise-dominated and hence unusable.
| Quadrant | # 1 sec bins | Bins with >0 counts | Bins with >2000 counts | High rate bins dominated by noise | Noise dominated (total time) | Noise dominated (detector-on time) | Marked lightcurve |
|---|---|---|---|---|---|---|---|
| A | 77873 | 65261 | 19 | 19 | 0.02% | 0.03% |  |
| B | 77875 | 65226 | 2 | 2 | 0.00% | 0.00% |  |
| C | 77874 | 65262 | 3 | 3 | 0.00% | 0.00% | 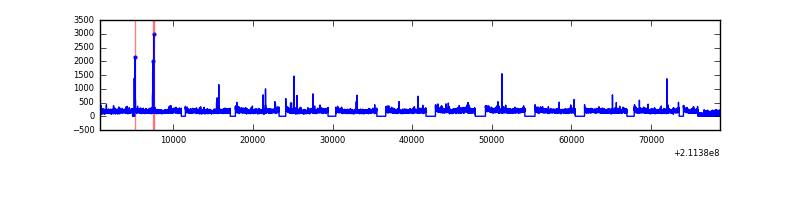 |
| D | 77875 | 65008 | 455 | 455 | 0.58% | 0.70% |  |
Top three noisy pixels from each quadrant. If the there are fewer than three noisy pixels in the level2.evt file, extra rows are filled as -1
| Pixel properties | Quadrant properties | ||||||
|---|---|---|---|---|---|---|---|
| Quadrant | DetID | PixID | Counts | Sigma | Mean | Median | Sigma |
| A | 0 | 50 | 546773 | 773.45 | 3176 | 3118 | 702.9 |
| A | 4 | 2 | 490688 | 693.66 | 3176 | 3118 | 702.9 |
| A | 0 | 247 | 76446 | 104.32 | 3176 | 3118 | 702.9 |
| B | 15 | 204 | 652676 | 1061.95 | 3213 | 3133 | 611.6 |
| B | 0 | 187 | 192249 | 309.19 | 3213 | 3133 | 611.6 |
| B | 4 | 48 | 152732 | 244.58 | 3213 | 3133 | 611.6 |
| C | 1 | 16 | 316439 | 446.61 | 3159 | 3123 | 701.5 |
| C | 12 | 4 | 82417 | 113.03 | 3159 | 3123 | 701.5 |
| C | 14 | 67 | 48811 | 65.12 | 3159 | 3123 | 701.5 |
| D | 2 | 136 | 2050502 | 2793.68 | 3105 | 2993 | 732.9 |
| D | 2 | 33 | 1916481 | 2610.81 | 3105 | 2993 | 732.9 |
| D | 14 | 34 | 1614710 | 2199.07 | 3105 | 2993 | 732.9 |
Histogram calculated using DETX and DETY for each event in the final _common_clean file
| Quadrant A | 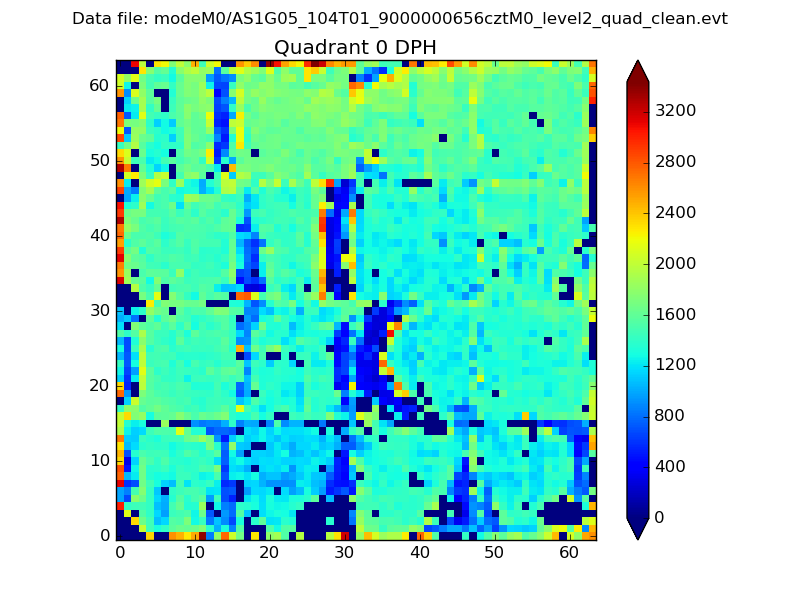 |
 |
Quadrant B |
|---|---|---|---|
| Quadrant D | 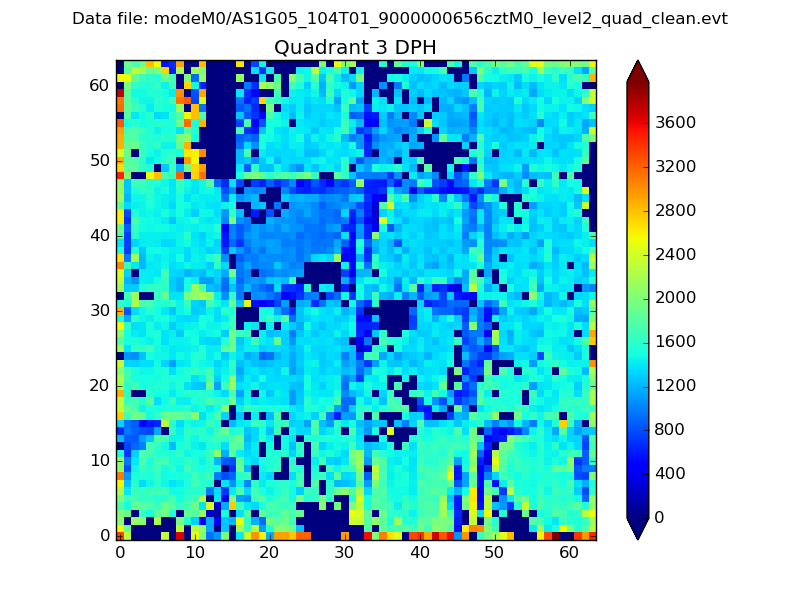 |
 |
Quadrant C |
| Plot type | Count rate plots | Images |
|---|---|---|
| Comparison with Poisson distribution Blue bars denote a histogram of data divided into 1 sec bins. Red curve is a Poisson curve with rate = median count rate of data. |
 |
 |
| Quadrant-wise count rates Data is divided into 100 sec bins |
 |
|
| Module-wise count rates for Quadrant A Data is divided into 100 sec bins |
 |
 |
| Module-wise count rates for Quadrant B Data is divided into 100 sec bins |
 |
 |
| Module-wise count rates for Quadrant C Data is divided into 100 sec bins |
 |
 |
| Module-wise count rates for Quadrant D Data is divided into 100 sec bins |
 |
 |
| Parameter | Plot |
|---|---|
| CZT HV Monitor |  |
| D_VDD |  |
| Temperature 1 |  |
| Veto HV Monitor |  |
| Veto LLD |  |
| Alpha Counter |  |
| _CPM_Rate |  |
| CZT Counter |  |
| +2.5 Volts monitor |  |
| +5 Volts monitor |  |
| _ROLL_ROT |  |
| _Roll_DEC |  |
| _Roll_RA |  |
| Veto Counter |  |