| Param | Original file | Final file |
|---|---|---|
| Filename | modeM0/AS1G05_214T01_9000000652cztM0_level2_bc.evt | modeM0/AS1G05_214T01_9000000652cztM0_level2_quad_clean.evt |
| Size (bytes) | 5,236,038,720 | 1,729,987,200 |
| Size | 4.9 GB | 1.6 GB |
| Events in quadrant A | 35,642,053 | 10,348,968 |
| Events in quadrant B | 35,991,232 | 10,453,404 |
| Events in quadrant C | 32,540,938 | 10,527,712 |
| Events in quadrant D | 43,249,138 | 9,857,176 |
| Mode M0 | |||
|---|---|---|---|
| Quadrant | BADHDUFLAG | Total packets | Discarded packets |
| A | 0 | 350001 | 0 |
| B | 0 | 349444 | 0 |
| C | 0 | 337155 | 0 |
| D | 0 | 377311 | 0 |
| Mode M9 | |||
|---|---|---|---|
| Quadrant | BADHDUFLAG | Total packets | Discarded packets |
| A | 0 | 250 | 0 |
| B | 0 | 250 | 0 |
| C | 0 | 250 | 0 |
| D | 0 | 250 | 0 |
| Mode SS | |||
|---|---|---|---|
| Quadrant | BADHDUFLAG | Total packets | Discarded packets |
| A | 0 | 3332 | 0 |
| B | 0 | 3332 | 0 |
| C | 0 | 3330 | 0 |
| D | 0 | 3332 | 0 |
| Quadrant | Total seconds | Saturated seconds | Saturation percentage |
|---|---|---|---|
| A | 163630 | 3262 | 1.993522% |
| B | 163630 | 3044 | 1.860295% |
| C | 163626 | 1738 | 1.062178% |
| D | 163627 | 4602 | 2.812494% |
Noise dominated data is calculated using 1-second bins in cleaned event files. If a bin has >2000 counts, and if more than 50% of those come from <1% of pixels, then it is considered to be noise-dominated and hence unusable.
| Quadrant | # 1 sec bins | Bins with >0 counts | Bins with >2000 counts | High rate bins dominated by noise | Noise dominated (total time) | Noise dominated (detector-on time) | Marked lightcurve |
|---|---|---|---|---|---|---|---|
| A | 188717 | 163640 | 132 | 132 | 0.07% | 0.08% |  |
| B | 188717 | 163636 | 32 | 32 | 0.02% | 0.02% |  |
| C | 188717 | 163639 | 8 | 8 | 0.00% | 0.00% | 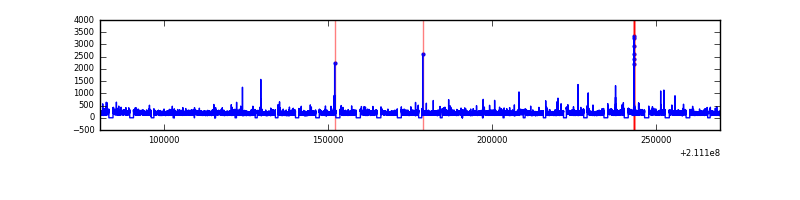 |
| D | 188717 | 163639 | 553 | 553 | 0.29% | 0.34% |  |
Top three noisy pixels from each quadrant. If the there are fewer than three noisy pixels in the level2.evt file, extra rows are filled as -1
| Pixel properties | Quadrant properties | ||||||
|---|---|---|---|---|---|---|---|
| Quadrant | DetID | PixID | Counts | Sigma | Mean | Median | Sigma |
| A | 0 | 247 | 2310024 | 1309.42 | 8023 | 7852 | 1758.2 |
| A | 0 | 50 | 1241048 | 701.41 | 8023 | 7852 | 1758.2 |
| A | 4 | 2 | 832457 | 469.02 | 8023 | 7852 | 1758.2 |
| B | 4 | 80 | 1348768 | 854.61 | 8181 | 7932 | 1568.9 |
| B | 15 | 204 | 1284561 | 813.69 | 8181 | 7932 | 1568.9 |
| B | 4 | 48 | 458722 | 287.32 | 8181 | 7932 | 1568.9 |
| C | 1 | 16 | 946523 | 527.08 | 8008 | 7865 | 1780.9 |
| C | 12 | 4 | 86623 | 44.22 | 8008 | 7865 | 1780.9 |
| C | 15 | 1 | 61122 | 29.91 | 8008 | 7865 | 1780.9 |
| D | 2 | 33 | 4980633 | 2663.37 | 7933 | 7596 | 1867.2 |
| D | 13 | 53 | 1335206 | 711.02 | 7933 | 7596 | 1867.2 |
| D | 2 | 136 | 1197966 | 637.52 | 7933 | 7596 | 1867.2 |
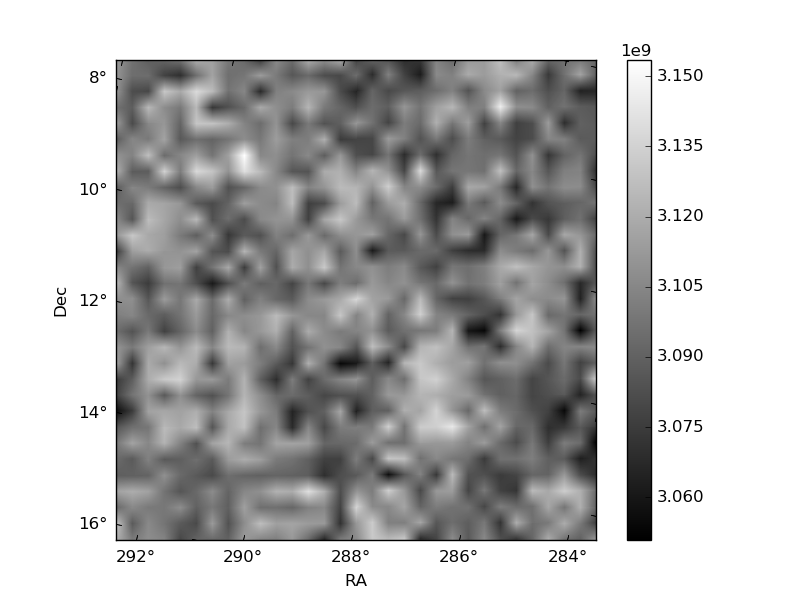
Histogram calculated using DETX and DETY for each event in the final _common_clean file
| Quadrant A |  |
 |
Quadrant B |
|---|---|---|---|
| Quadrant D |  |
 |
Quadrant C |
| Plot type | Count rate plots | Images |
|---|---|---|
| Comparison with Poisson distribution Blue bars denote a histogram of data divided into 1 sec bins. Red curve is a Poisson curve with rate = median count rate of data. |
 |
 |
| Quadrant-wise count rates Data is divided into 100 sec bins |
 |
|
| Module-wise count rates for Quadrant A Data is divided into 100 sec bins |
 |
 |
| Module-wise count rates for Quadrant B Data is divided into 100 sec bins |
 |
 |
| Module-wise count rates for Quadrant C Data is divided into 100 sec bins |
 |
 |
| Module-wise count rates for Quadrant D Data is divided into 100 sec bins |
 |
 |
| Parameter | Plot |
|---|---|
| CZT HV Monitor |  |
| D_VDD |  |
| Temperature 1 |  |
| Veto HV Monitor |  |
| Veto LLD |  |
| Alpha Counter |  |
| _CPM_Rate |  |
| CZT Counter |  |
| +2.5 Volts monitor |  |
| +5 Volts monitor |  |
| _ROLL_ROT |  |
| _Roll_DEC |  |
| _Roll_RA |  |
| Veto Counter |  |