| Param | Original file | Final file |
|---|---|---|
| Filename | modeM0/AS1G05_230T05_9000000648cztM0_level2_bc.evt | modeM0/AS1G05_230T05_9000000648cztM0_level2_quad_clean.evt |
| Size (bytes) | 3,892,884,480 | 1,334,756,160 |
| Size | 3.6 GB | 1.2 GB |
| Events in quadrant A | 20,370,359 | 8,377,565 |
| Events in quadrant B | 30,946,266 | 8,602,660 |
| Events in quadrant C | 20,499,322 | 8,564,858 |
| Events in quadrant D | 38,810,026 | 7,572,023 |
| Mode SS | |||
|---|---|---|---|
| Quadrant | BADHDUFLAG | Total packets | Discarded packets |
| A | 0 | 2186 | 0 |
| B | 0 | 2168 | 0 |
| C | 0 | 2176 | 0 |
| D | 0 | 2178 | 0 |
| Mode M0 | |||
|---|---|---|---|
| Quadrant | BADHDUFLAG | Total packets | Discarded packets |
| A | 0 | 220693 | 0 |
| B | 0 | 250470 | 0 |
| C | 0 | 218790 | 0 |
| D | 0 | 301384 | 0 |
| Mode M9 | |||
|---|---|---|---|
| Quadrant | BADHDUFLAG | Total packets | Discarded packets |
| A | 0 | 152 | 0 |
| B | 0 | 152 | 0 |
| C | 0 | 152 | 0 |
| D | 0 | 152 | 0 |
| Quadrant | Total seconds | Saturated seconds | Saturation percentage |
|---|---|---|---|
| A | 106730 | 1577 | 1.477560% |
| B | 106607 | 3361 | 3.152701% |
| C | 106723 | 948 | 0.888281% |
| D | 106437 | 9652 | 9.068275% |
Noise dominated data is calculated using 1-second bins in cleaned event files. If a bin has >2000 counts, and if more than 50% of those come from <1% of pixels, then it is considered to be noise-dominated and hence unusable.
| Quadrant | # 1 sec bins | Bins with >0 counts | Bins with >2000 counts | High rate bins dominated by noise | Noise dominated (total time) | Noise dominated (detector-on time) | Marked lightcurve |
|---|---|---|---|---|---|---|---|
| A | 122663 | 107281 | 29 | 29 | 0.02% | 0.03% |  |
| B | 122663 | 107272 | 493 | 493 | 0.40% | 0.46% |  |
| C | 122663 | 107314 | 4 | 4 | 0.00% | 0.00% | 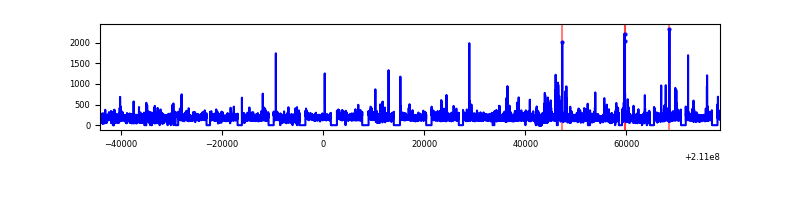 |
| D | 122663 | 107093 | 1068 | 1068 | 0.87% | 1.00% |  |
Top three noisy pixels from each quadrant. If the there are fewer than three noisy pixels in the level2.evt file, extra rows are filled as -1
| Pixel properties | Quadrant properties | ||||||
|---|---|---|---|---|---|---|---|
| Quadrant | DetID | PixID | Counts | Sigma | Mean | Median | Sigma |
| A | 0 | 50 | 621980 | 549.08 | 5045 | 4920 | 1123.8 |
| A | 15 | 174 | 107258 | 91.06 | 5045 | 4920 | 1123.8 |
| A | 13 | 14 | 69394 | 57.37 | 5045 | 4920 | 1123.8 |
| B | 8 | 3 | 5988178 | 6093.95 | 5116 | 4957 | 981.8 |
| B | 15 | 204 | 1841287 | 1870.31 | 5116 | 4957 | 981.8 |
| B | 4 | 48 | 1322434 | 1341.86 | 5116 | 4957 | 981.8 |
| C | 12 | 4 | 217976 | 188.5 | 5076 | 4988 | 1129.9 |
| C | 1 | 16 | 141802 | 121.09 | 5076 | 4988 | 1129.9 |
| C | 10 | 34 | 108900 | 91.97 | 5076 | 4988 | 1129.9 |
| D | 13 | 235 | 4862331 | 4239.91 | 4812 | 4607 | 1145.7 |
| D | 2 | 33 | 4804951 | 4189.83 | 4812 | 4607 | 1145.7 |
| D | 12 | 22 | 4145918 | 3614.61 | 4812 | 4607 | 1145.7 |
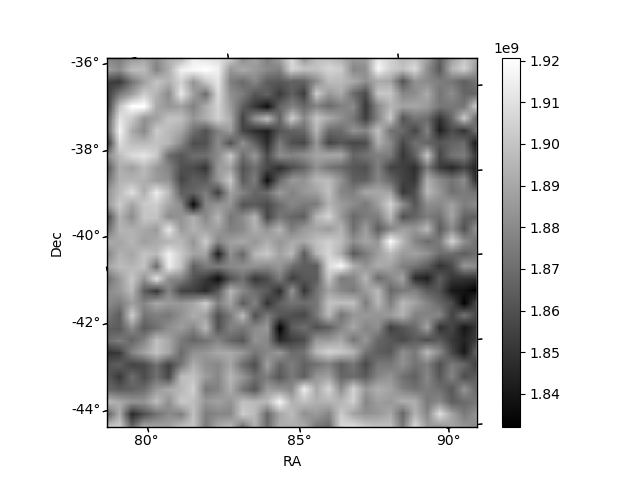
Histogram calculated using DETX and DETY for each event in the final _common_clean file
| Quadrant A |  |
 |
Quadrant B |
|---|---|---|---|
| Quadrant D |  |
 |
Quadrant C |
| Plot type | Count rate plots | Images |
|---|---|---|
| Comparison with Poisson distribution Blue bars denote a histogram of data divided into 1 sec bins. Red curve is a Poisson curve with rate = median count rate of data. |
 |
 |
| Quadrant-wise count rates Data is divided into 100 sec bins |
 |
|
| Module-wise count rates for Quadrant A Data is divided into 100 sec bins |
 |
 |
| Module-wise count rates for Quadrant B Data is divided into 100 sec bins |
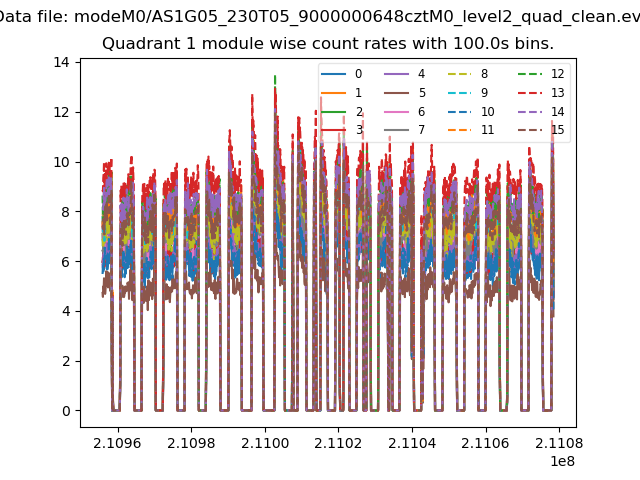 |
 |
| Module-wise count rates for Quadrant C Data is divided into 100 sec bins |
 |
 |
| Module-wise count rates for Quadrant D Data is divided into 100 sec bins |
 |
 |
| Parameter | Plot |
|---|---|
| CZT HV Monitor |  |
| D_VDD | 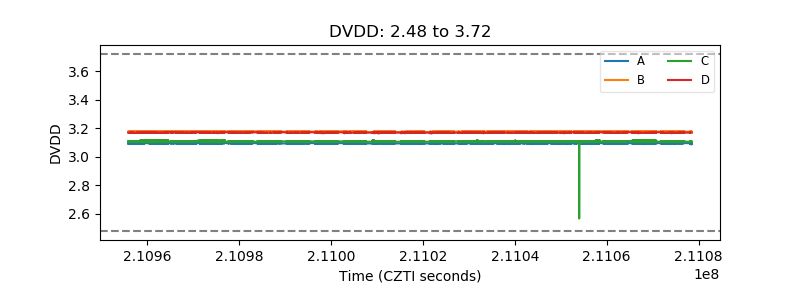 |
| Temperature 1 |  |
| Veto HV Monitor |  |
| Veto LLD |  |
| Alpha Counter | 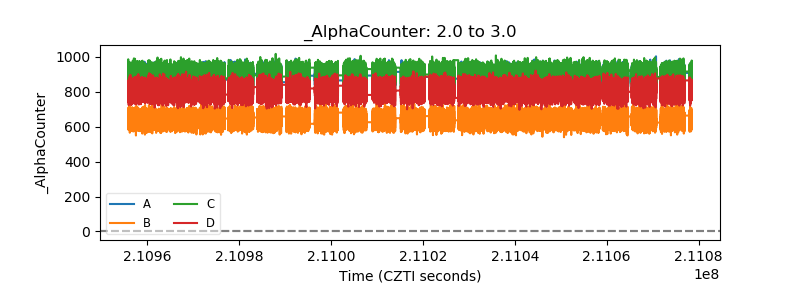 |
| _CPM_Rate |  |
| CZT Counter | 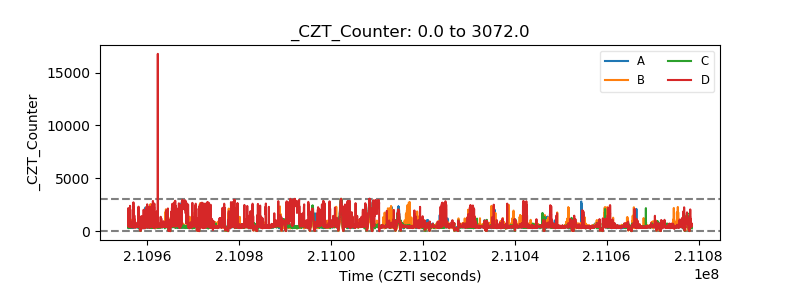 |
| +2.5 Volts monitor |  |
| +5 Volts monitor |  |
| _ROLL_ROT | 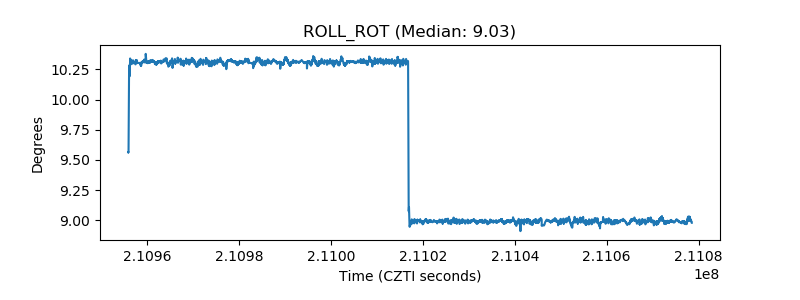 |
| _Roll_DEC |  |
| _Roll_RA |  |
| Veto Counter |  |