| Param | Original file | Final file |
|---|---|---|
| Filename | modeM0/AS1G05_105T01_9000000644cztM0_level2.evt | modeM0/AS1G05_105T01_9000000644cztM0_level2_quad_clean.evt |
| Size (bytes) | 5,659,202,880 | 1,073,747,520 |
| Size | 5.3 GB | 1.0 GB |
| Events in quadrant A | 32,664,709 | 6,214,915 |
| Events in quadrant B | 38,836,090 | 8,255,892 |
| Events in quadrant C | 31,017,761 | 7,873,029 |
| Events in quadrant D | 64,057,189 | 5,282,567 |
| Mode SS | |||
|---|---|---|---|
| Quadrant | BADHDUFLAG | Total packets | Discarded packets |
| A | 0 | 1469 | 0 |
| B | 0 | 1471 | 0 |
| C | 0 | 1469 | 0 |
| D | 0 | 1470 | 0 |
| Mode M0 | |||
|---|---|---|---|
| Quadrant | BADHDUFLAG | Total packets | Discarded packets |
| A | 0 | 148170 | 0 |
| B | 0 | 163756 | 0 |
| C | 0 | 145290 | 0 |
| D | 0 | 240959 | 0 |
| Mode M9 | |||
|---|---|---|---|
| Quadrant | BADHDUFLAG | Total packets | Discarded packets |
| A | 1 | 251318637792 | 0 |
| B | 1 | 251318637792 | 0 |
| C | 1 | 251318637792 | 0 |
| D | 1 | 251318637792 | 0 |
| Quadrant | Total seconds | Saturated seconds | Saturation percentage |
|---|---|---|---|
| A | 71222 | 967 | 1.357727% |
| B | 71199 | 2562 | 3.598365% |
| C | 71221 | 676 | 0.949158% |
| D | 71740 | 11651 | 16.240591% |
Noise dominated data is calculated using 1-second bins in cleaned event files. If a bin has >2000 counts, and if more than 50% of those come from <1% of pixels, then it is considered to be noise-dominated and hence unusable.
| Quadrant | # 1 sec bins | Bins with >0 counts | Bins with >2000 counts | High rate bins dominated by noise | Noise dominated (total time) | Noise dominated (detector-on time) | Marked lightcurve |
|---|---|---|---|---|---|---|---|
| A | 84463 | 71398 | 121 | 121 | 0.14% | 0.17% |  |
| B | 84463 | 71352 | 1332 | 1332 | 1.58% | 1.87% |  |
| C | 84463 | 71394 | 1 | 1 | 0.00% | 0.00% |  |
| D | 84079 | 71762 | 8920 | 8920 | 10.61% | 12.43% |  |
Top three noisy pixels from each quadrant. If the there are fewer than three noisy pixels in the level2.evt file, extra rows are filled as -1
| Pixel properties | Quadrant properties | ||||||
|---|---|---|---|---|---|---|---|
| Quadrant | DetID | PixID | Counts | Sigma | Mean | Median | Sigma |
| A | 13 | 251 | 544769 | 326.4 | 8178 | 7996 | 1644.5 |
| A | 0 | 50 | 419799 | 250.41 | 8178 | 7996 | 1644.5 |
| A | 15 | 174 | 166564 | 96.42 | 8178 | 7996 | 1644.5 |
| B | 10 | 16 | 4475942 | 2928.01 | 8148 | 7955 | 1525.9 |
| B | 4 | 80 | 1242611 | 809.11 | 8148 | 7955 | 1525.9 |
| B | 15 | 204 | 729317 | 472.73 | 8148 | 7955 | 1525.9 |
| C | 12 | 4 | 93669 | 47.43 | 7894 | 7912 | 1808.2 |
| C | 13 | 61 | 64503 | 31.3 | 7894 | 7912 | 1808.2 |
| C | 1 | 16 | 57105 | 27.21 | 7894 | 7912 | 1808.2 |
| D | 12 | 22 | 12287044 | 6956.5 | 7327 | 7112 | 1765.2 |
| D | 13 | 235 | 9998730 | 5660.18 | 7327 | 7112 | 1765.2 |
| D | 13 | 239 | 9038957 | 5116.48 | 7327 | 7112 | 1765.2 |
Histogram calculated using DETX and DETY for each event in the final _common_clean file
| Quadrant A |  |
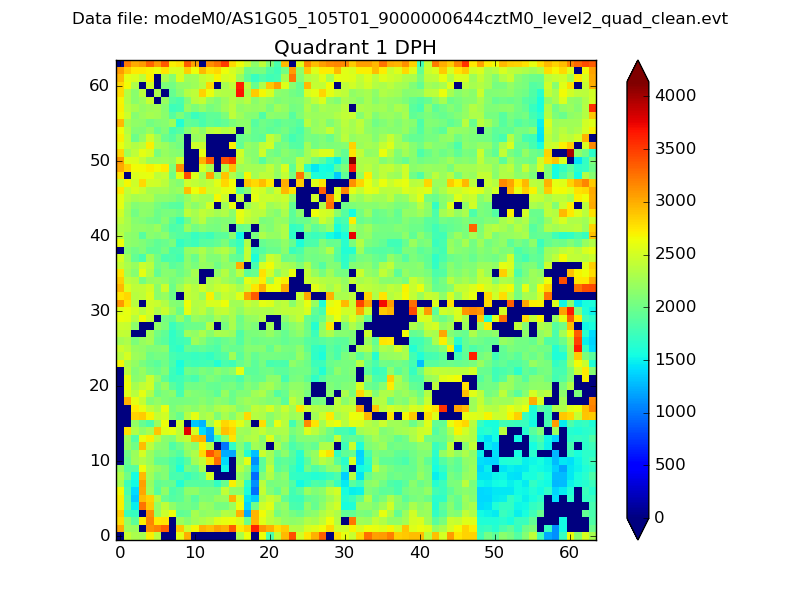 |
Quadrant B |
|---|---|---|---|
| Quadrant D |  |
 |
Quadrant C |
| Plot type | Count rate plots | Images |
|---|---|---|
| Comparison with Poisson distribution Blue bars denote a histogram of data divided into 1 sec bins. Red curve is a Poisson curve with rate = median count rate of data. |
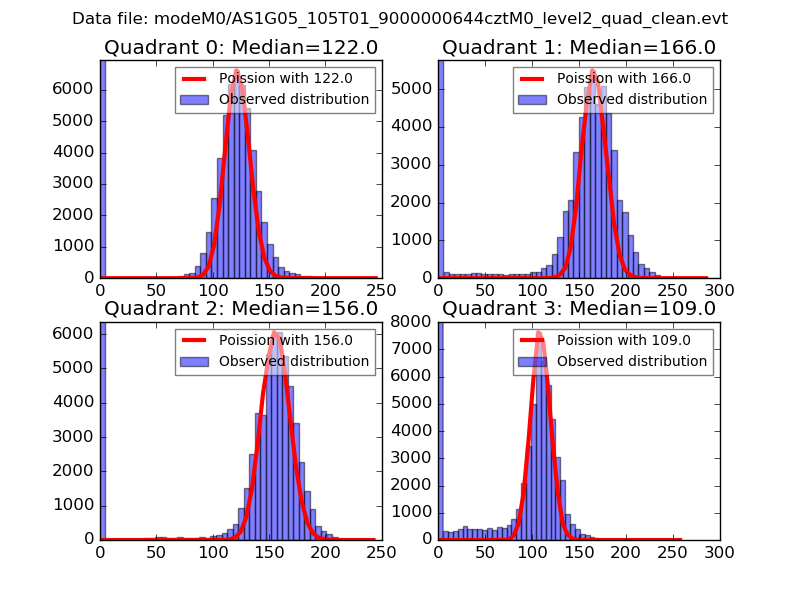 |
 |
| Quadrant-wise count rates Data is divided into 100 sec bins |
 |
|
| Module-wise count rates for Quadrant A Data is divided into 100 sec bins |
 |
 |
| Module-wise count rates for Quadrant B Data is divided into 100 sec bins |
 |
 |
| Module-wise count rates for Quadrant C Data is divided into 100 sec bins |
 |
 |
| Module-wise count rates for Quadrant D Data is divided into 100 sec bins |
 |
 |
| Parameter | Plot |
|---|---|
| CZT HV Monitor |  |
| D_VDD |  |
| Temperature 1 | 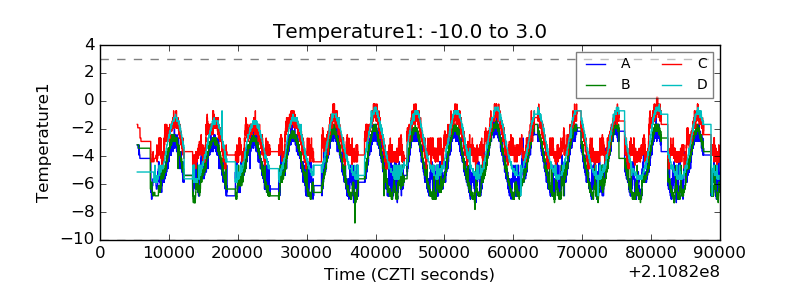 |
| Veto HV Monitor | 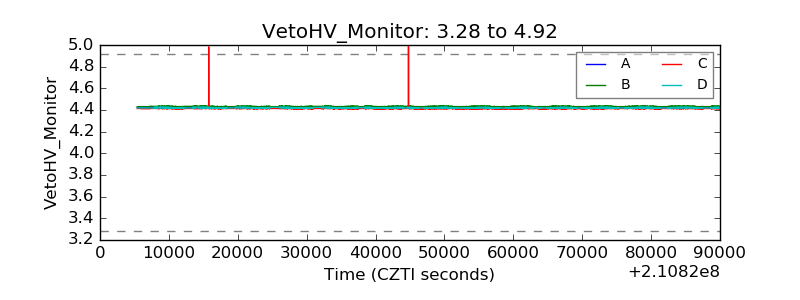 |
| Veto LLD |  |
| Alpha Counter |  |
| _CPM_Rate |  |
| CZT Counter |  |
| +2.5 Volts monitor | 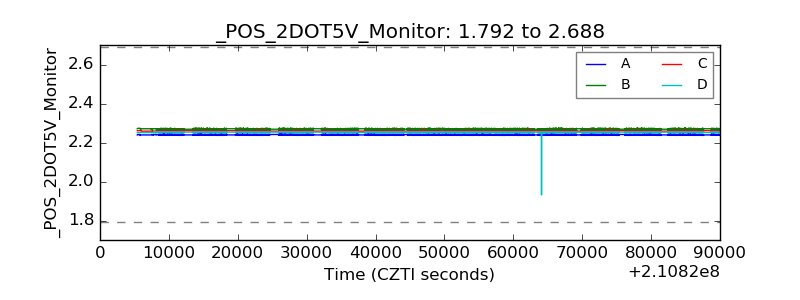 |
| +5 Volts monitor |  |
| _ROLL_ROT |  |
| _Roll_DEC |  |
| _Roll_RA |  |
| Veto Counter |  |