| Param | Original file | Final file |
|---|---|---|
| Filename | modeM0/AS1G05_103T01_9000000642cztM0_level2_bc.evt | modeM0/AS1G05_103T01_9000000642cztM0_level2_quad_clean.evt |
| Size (bytes) | 3,354,333,120 | 946,895,040 |
| Size | 3.1 GB | 903.0 MB |
| Events in quadrant A | 17,516,693 | 5,898,560 |
| Events in quadrant B | 19,410,787 | 5,968,467 |
| Events in quadrant C | 16,739,446 | 5,847,542 |
| Events in quadrant D | 42,051,443 | 5,060,618 |
| Mode SS | |||
|---|---|---|---|
| Quadrant | BADHDUFLAG | Total packets | Discarded packets |
| A | 0 | 1754 | 0 |
| B | 0 | 1754 | 0 |
| C | 0 | 1754 | 0 |
| D | 0 | 1754 | 0 |
| Mode M0 | |||
|---|---|---|---|
| Quadrant | BADHDUFLAG | Total packets | Discarded packets |
| A | 0 | 180012 | 0 |
| B | 0 | 184237 | 0 |
| C | 0 | 176465 | 0 |
| D | 0 | 284638 | 0 |
| Mode M9 | |||
|---|---|---|---|
| Quadrant | BADHDUFLAG | Total packets | Discarded packets |
| A | 0 | 129 | 0 |
| B | 0 | 129 | 0 |
| C | 0 | 129 | 0 |
| D | 0 | 129 | 0 |
| Quadrant | Total seconds | Saturated seconds | Saturation percentage |
|---|---|---|---|
| A | 86075 | 1365 | 1.585826% |
| B | 86081 | 1219 | 1.416108% |
| C | 86079 | 712 | 0.827147% |
| D | 86080 | 12376 | 14.377323% |
Noise dominated data is calculated using 1-second bins in cleaned event files. If a bin has >2000 counts, and if more than 50% of those come from <1% of pixels, then it is considered to be noise-dominated and hence unusable.
| Quadrant | # 1 sec bins | Bins with >0 counts | Bins with >2000 counts | High rate bins dominated by noise | Noise dominated (total time) | Noise dominated (detector-on time) | Marked lightcurve |
|---|---|---|---|---|---|---|---|
| A | 98157 | 86083 | 53 | 53 | 0.05% | 0.06% |  |
| B | 98157 | 86082 | 13 | 13 | 0.01% | 0.02% | 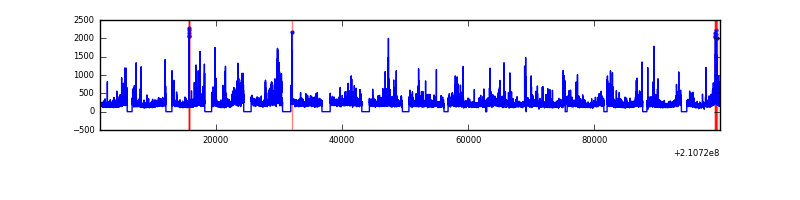 |
| C | 98157 | 86083 | 0 | 0 | 0.00% | 0.00% |  |
| D | 98157 | 86046 | 2262 | 2262 | 2.30% | 2.63% |  |
Top three noisy pixels from each quadrant. If the there are fewer than three noisy pixels in the level2.evt file, extra rows are filled as -1
| Pixel properties | Quadrant properties | ||||||
|---|---|---|---|---|---|---|---|
| Quadrant | DetID | PixID | Counts | Sigma | Mean | Median | Sigma |
| A | 0 | 50 | 524111 | 548.44 | 4248 | 4141 | 948.1 |
| A | 15 | 174 | 297464 | 309.38 | 4248 | 4141 | 948.1 |
| A | 13 | 251 | 148490 | 152.25 | 4248 | 4141 | 948.1 |
| B | 8 | 3 | 1125766 | 1328.28 | 4310 | 4175 | 844.4 |
| B | 15 | 204 | 728125 | 857.36 | 4310 | 4175 | 844.4 |
| B | 0 | 219 | 388459 | 455.1 | 4310 | 4175 | 844.4 |
| C | 1 | 16 | 151526 | 156.4 | 4192 | 4115 | 942.5 |
| C | 9 | 54 | 66808 | 66.52 | 4192 | 4115 | 942.5 |
| C | 8 | 128 | 41399 | 39.56 | 4192 | 4115 | 942.5 |
| D | 12 | 22 | 11412546 | 12302.7 | 3884 | 3721 | 927.3 |
| D | 13 | 235 | 5620492 | 6056.84 | 3884 | 3721 | 927.3 |
| D | 13 | 239 | 2845615 | 3064.56 | 3884 | 3721 | 927.3 |
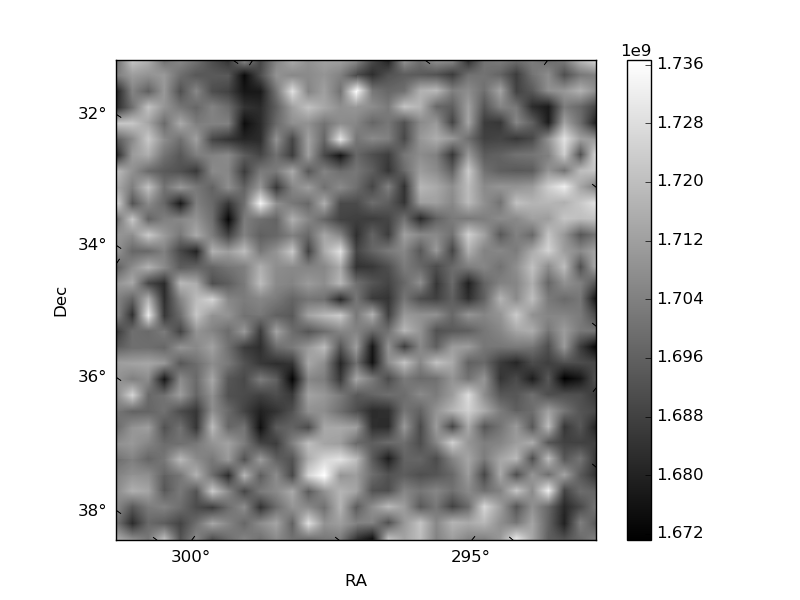
Histogram calculated using DETX and DETY for each event in the final _common_clean file
| Quadrant A |  |
 |
Quadrant B |
|---|---|---|---|
| Quadrant D |  |
 |
Quadrant C |
| Plot type | Count rate plots | Images |
|---|---|---|
| Comparison with Poisson distribution Blue bars denote a histogram of data divided into 1 sec bins. Red curve is a Poisson curve with rate = median count rate of data. |
 |
 |
| Quadrant-wise count rates Data is divided into 100 sec bins |
 |
|
| Module-wise count rates for Quadrant A Data is divided into 100 sec bins |
 |
 |
| Module-wise count rates for Quadrant B Data is divided into 100 sec bins |
 |
 |
| Module-wise count rates for Quadrant C Data is divided into 100 sec bins |
 |
 |
| Module-wise count rates for Quadrant D Data is divided into 100 sec bins |
 |
 |
| Parameter | Plot |
|---|---|
| CZT HV Monitor |  |
| D_VDD | 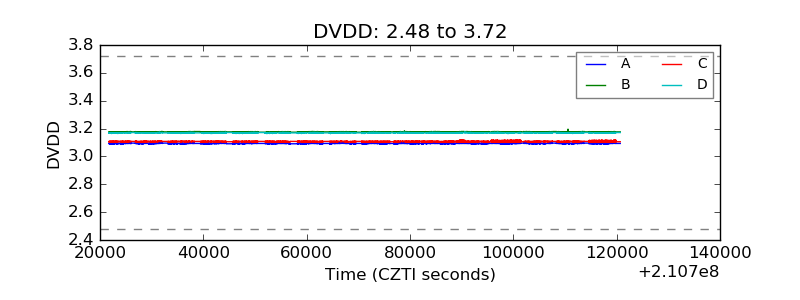 |
| Temperature 1 |  |
| Veto HV Monitor |  |
| Veto LLD |  |
| Alpha Counter | 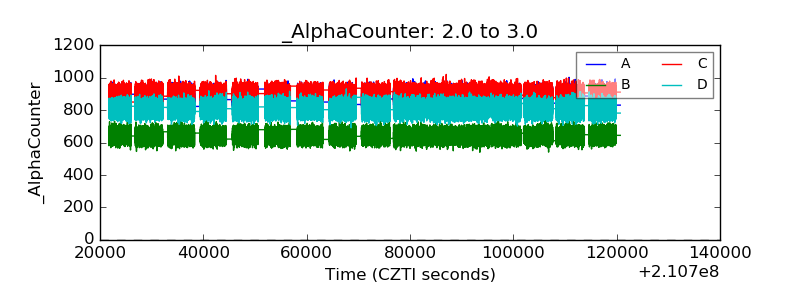 |
| _CPM_Rate |  |
| CZT Counter |  |
| +2.5 Volts monitor |  |
| +5 Volts monitor | 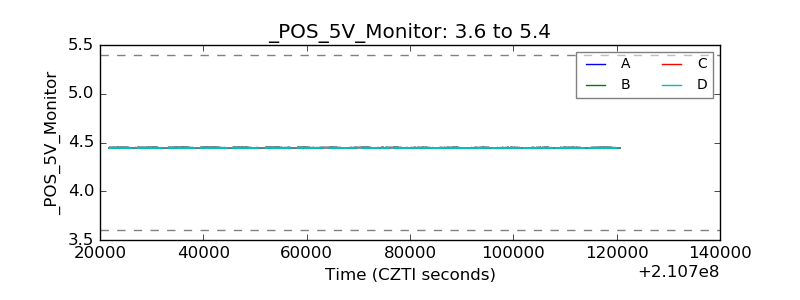 |
| _ROLL_ROT |  |
| _Roll_DEC |  |
| _Roll_RA |  |
| Veto Counter | 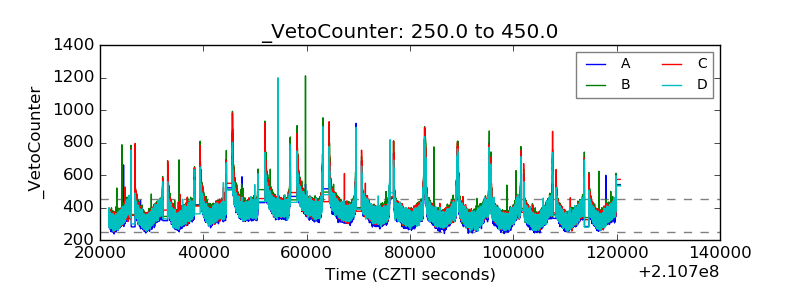 |