| Param | Original file | Final file |
|---|---|---|
| Filename | modeM0/AS1G05_218T04_9000000640cztM0_level2.evt | modeM0/AS1G05_218T04_9000000640cztM0_level2_quad_clean.evt |
| Size (bytes) | 8,179,335,360 | 1,163,001,600 |
| Size | 7.6 GB | 1.1 GB |
| Events in quadrant A | 53,831,175 | 7,253,268 |
| Events in quadrant B | 49,346,875 | 7,360,154 |
| Events in quadrant C | 52,052,337 | 7,183,469 |
| Events in quadrant D | 85,629,753 | 6,455,635 |
| Mode M9 | |||
|---|---|---|---|
| Quadrant | BADHDUFLAG | Total packets | Discarded packets |
| A | 0 | 138 | 0 |
| B | 0 | 138 | 0 |
| C | 0 | 138 | 0 |
| D | 0 | 138 | 0 |
| Mode SS | |||
|---|---|---|---|
| Quadrant | BADHDUFLAG | Total packets | Discarded packets |
| A | 0 | 2074 | 0 |
| B | 0 | 2074 | 0 |
| C | 0 | 2074 | 0 |
| D | 0 | 2064 | 0 |
| Mode M0 | |||
|---|---|---|---|
| Quadrant | BADHDUFLAG | Total packets | Discarded packets |
| A | 0 | 230005 | 0 |
| B | 0 | 214580 | 0 |
| C | 0 | 224277 | 0 |
| D | 0 | 325477 | 0 |
| Quadrant | Total seconds | Saturated seconds | Saturation percentage |
|---|---|---|---|
| A | 101711 | 3175 | 3.121590% |
| B | 101691 | 1529 | 1.503575% |
| C | 101708 | 1170 | 1.150352% |
| D | 101649 | 14324 | 14.091629% |
Noise dominated data is calculated using 1-second bins in cleaned event files. If a bin has >2000 counts, and if more than 50% of those come from <1% of pixels, then it is considered to be noise-dominated and hence unusable.
| Quadrant | # 1 sec bins | Bins with >0 counts | Bins with >2000 counts | High rate bins dominated by noise | Noise dominated (total time) | Noise dominated (detector-on time) | Marked lightcurve |
|---|---|---|---|---|---|---|---|
| A | 151811 | 101971 | 1339 | 1339 | 0.88% | 1.31% | 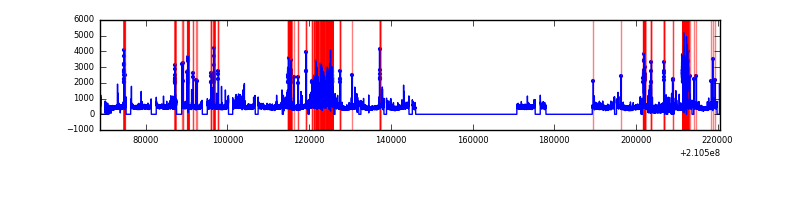 |
| B | 151811 | 101971 | 53 | 53 | 0.03% | 0.05% | 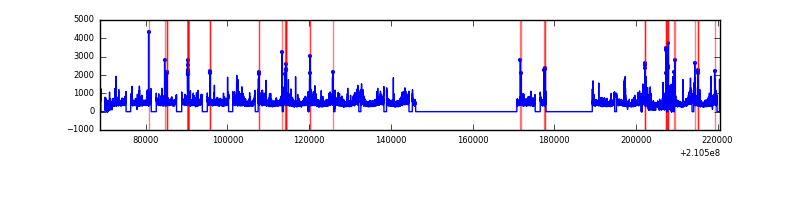 |
| C | 151811 | 101975 | 21 | 21 | 0.01% | 0.02% |  |
| D | 151811 | 101943 | 11735 | 11735 | 7.73% | 11.51% | 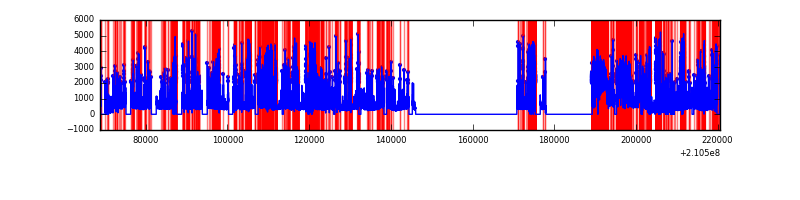 |
Top three noisy pixels from each quadrant. If the there are fewer than three noisy pixels in the level2.evt file, extra rows are filled as -1
| Pixel properties | Quadrant properties | ||||||
|---|---|---|---|---|---|---|---|
| Quadrant | DetID | PixID | Counts | Sigma | Mean | Median | Sigma |
| A | 13 | 251 | 3730479 | 1540.0 | 11926 | 11678 | 2414.8 |
| A | 0 | 247 | 1652580 | 679.52 | 11926 | 11678 | 2414.8 |
| A | 15 | 174 | 1044212 | 427.59 | 11926 | 11678 | 2414.8 |
| B | 15 | 204 | 1004260 | 431.91 | 12058 | 11782 | 2297.9 |
| B | 0 | 219 | 735382 | 314.9 | 12058 | 11782 | 2297.9 |
| B | 4 | 48 | 350232 | 147.29 | 12058 | 11782 | 2297.9 |
| C | 1 | 16 | 6675978 | 2497.26 | 11561 | 11620 | 2668.7 |
| C | 14 | 67 | 188723 | 66.36 | 11561 | 11620 | 2668.7 |
| C | 13 | 61 | 94186 | 30.94 | 11561 | 11620 | 2668.7 |
| D | 7 | 237 | 17698928 | 6651.14 | 10951 | 10639 | 2659.4 |
| D | 13 | 235 | 15120314 | 5681.53 | 10951 | 10639 | 2659.4 |
| D | 13 | 239 | 4181818 | 1568.44 | 10951 | 10639 | 2659.4 |
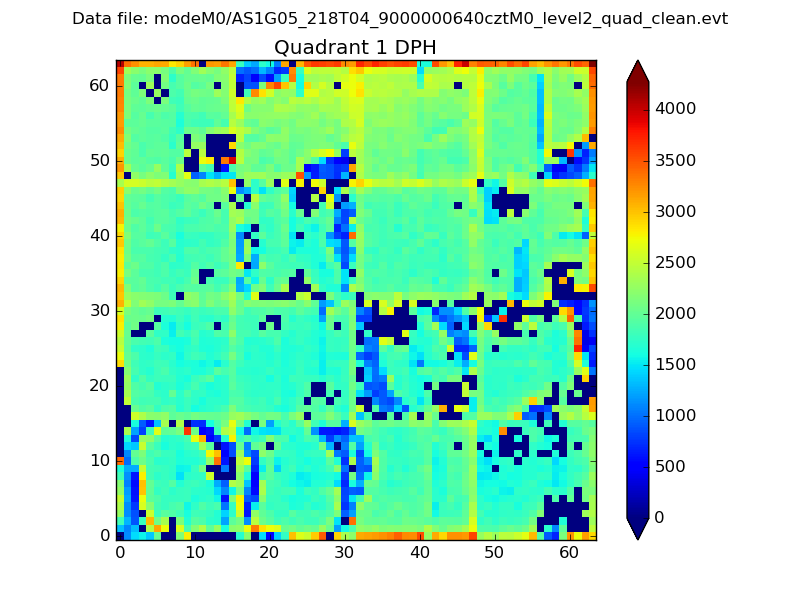
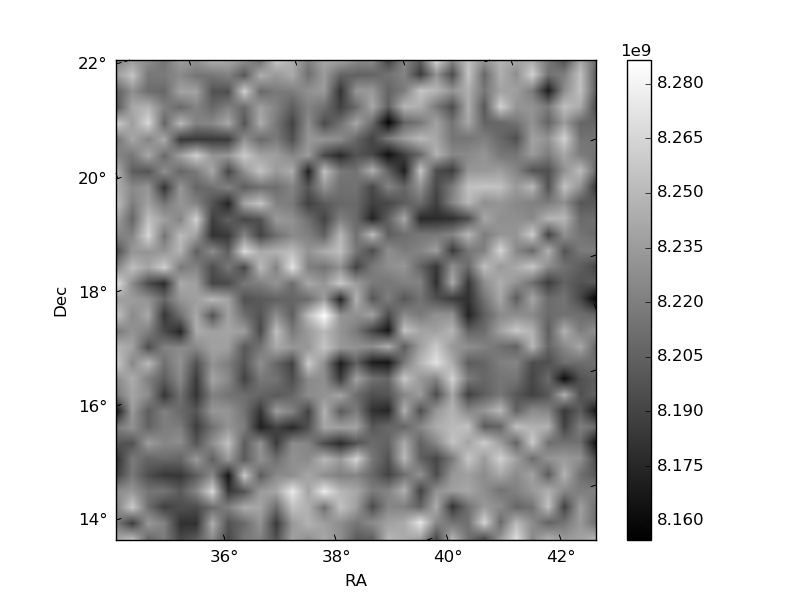
Histogram calculated using DETX and DETY for each event in the final _common_clean file
| Quadrant A |  |
 |
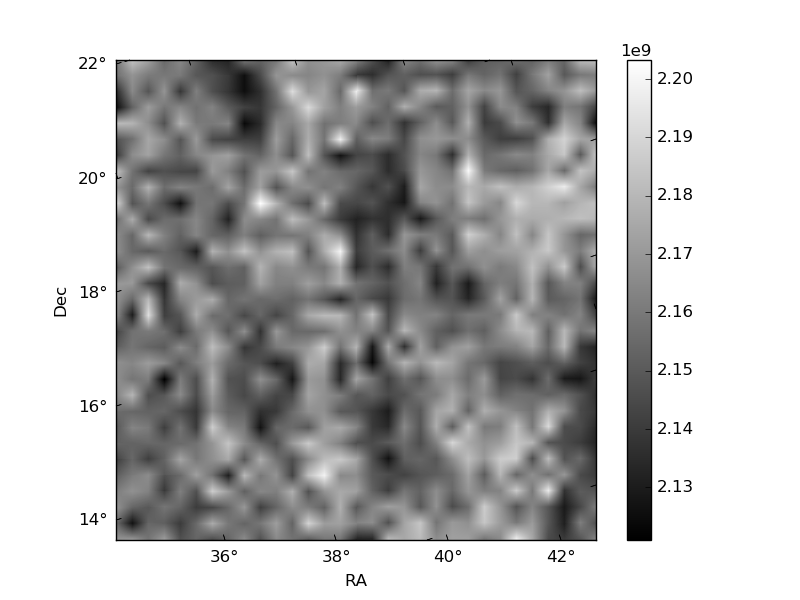
Quadrant B |
|---|---|---|---|
| Quadrant D |  |
 |
Quadrant C |
| Plot type | Count rate plots | Images |
|---|---|---|
| Comparison with Poisson distribution Blue bars denote a histogram of data divided into 1 sec bins. Red curve is a Poisson curve with rate = median count rate of data. |
 |
 |
| Quadrant-wise count rates Data is divided into 100 sec bins |
 |
|
| Module-wise count rates for Quadrant A Data is divided into 100 sec bins |
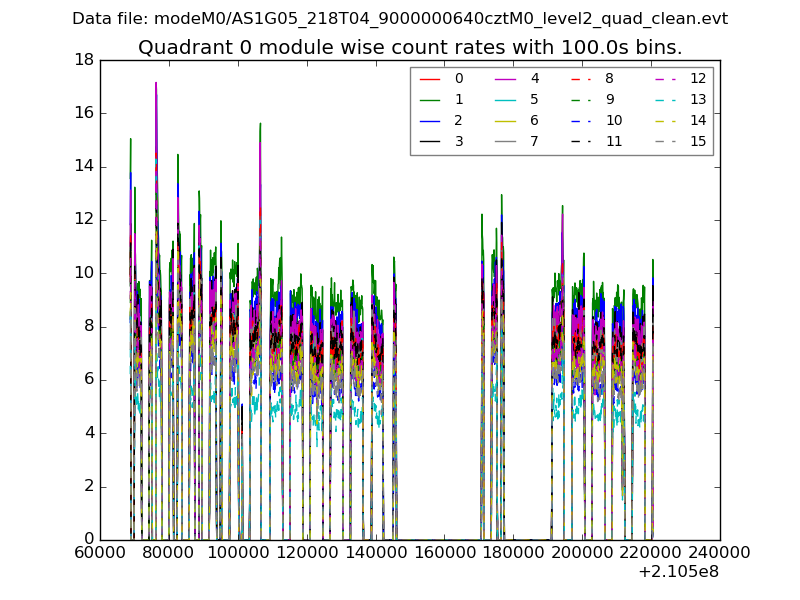 |
 |
| Module-wise count rates for Quadrant B Data is divided into 100 sec bins |
 |
 |
| Module-wise count rates for Quadrant C Data is divided into 100 sec bins |
 |
 |
| Module-wise count rates for Quadrant D Data is divided into 100 sec bins |
 |
 |
| Parameter | Plot |
|---|---|
| CZT HV Monitor |  |
| D_VDD |  |
| Temperature 1 |  |
| Veto HV Monitor | 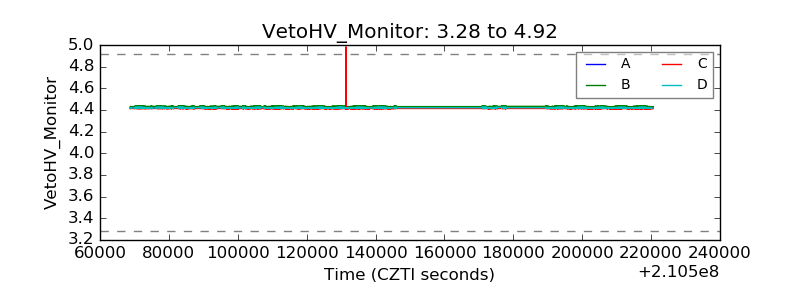 |
| Veto LLD |  |
| Alpha Counter |  |
| _CPM_Rate |  |
| CZT Counter |  |
| +2.5 Volts monitor |  |
| +5 Volts monitor |  |
| _ROLL_ROT | 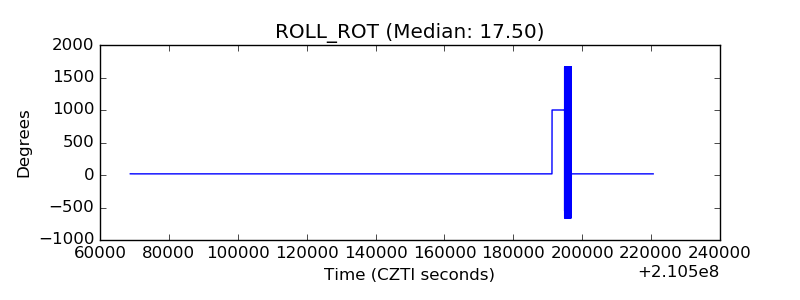 |
| _Roll_DEC |  |
| _Roll_RA |  |
| Veto Counter |  |