| Param | Original file | Final file |
|---|---|---|
| Filename | modeM0/AS1G05_250T02_9000000638cztM0_level2.evt | modeM0/AS1G05_250T02_9000000638cztM0_level2_quad_clean.evt |
| Size (bytes) | 11,116,033,920 | 2,011,864,320 |
| Size | 10.4 GB | 1.9 GB |
| Events in quadrant A | 75,726,831 | 12,556,801 |
| Events in quadrant B | 80,237,663 | 12,697,226 |
| Events in quadrant C | 72,348,430 | 12,732,892 |
| Events in quadrant D | 97,559,199 | 12,003,298 |
| Mode SS | |||
|---|---|---|---|
| Quadrant | BADHDUFLAG | Total packets | Discarded packets |
| A | 0 | 3254 | 0 |
| B | 0 | 3254 | 0 |
| C | 0 | 3254 | 0 |
| D | 0 | 3254 | 0 |
| Mode M0 | |||
|---|---|---|---|
| Quadrant | BADHDUFLAG | Total packets | Discarded packets |
| A | 0 | 338271 | 0 |
| B | 0 | 346926 | 0 |
| C | 0 | 328472 | 0 |
| D | 0 | 402902 | 0 |
| Mode M9 | |||
|---|---|---|---|
| Quadrant | BADHDUFLAG | Total packets | Discarded packets |
| A | 0 | 235 | 0 |
| B | 0 | 235 | 0 |
| C | 0 | 235 | 0 |
| D | 0 | 235 | 0 |
| Quadrant | Total seconds | Saturated seconds | Saturation percentage |
|---|---|---|---|
| A | 159802 | 2560 | 1.601982% |
| B | 159802 | 2332 | 1.459306% |
| C | 159802 | 1325 | 0.829151% |
| D | 159801 | 5070 | 3.172696% |
Noise dominated data is calculated using 1-second bins in cleaned event files. If a bin has >2000 counts, and if more than 50% of those come from <1% of pixels, then it is considered to be noise-dominated and hence unusable.
| Quadrant | # 1 sec bins | Bins with >0 counts | Bins with >2000 counts | High rate bins dominated by noise | Noise dominated (total time) | Noise dominated (detector-on time) | Marked lightcurve |
|---|---|---|---|---|---|---|---|
| A | 183508 | 159838 | 765 | 765 | 0.42% | 0.48% |  |
| B | 183508 | 159838 | 192 | 192 | 0.10% | 0.12% |  |
| C | 183508 | 159838 | 15 | 15 | 0.01% | 0.01% |  |
| D | 183508 | 159838 | 2709 | 2709 | 1.48% | 1.69% |  |
Top three noisy pixels from each quadrant. If the there are fewer than three noisy pixels in the level2.evt file, extra rows are filled as -1
| Pixel properties | Quadrant properties | ||||||
|---|---|---|---|---|---|---|---|
| Quadrant | DetID | PixID | Counts | Sigma | Mean | Median | Sigma |
| A | 15 | 174 | 1697291 | 454.38 | 18439 | 18046 | 3695.7 |
| A | 13 | 251 | 1086801 | 289.19 | 18439 | 18046 | 3695.7 |
| A | 0 | 50 | 947094 | 251.39 | 18439 | 18046 | 3695.7 |
| B | 15 | 204 | 4747475 | 1349.47 | 18608 | 18160 | 3504.6 |
| B | 0 | 219 | 1054053 | 295.58 | 18608 | 18160 | 3504.6 |
| B | 4 | 48 | 947475 | 265.17 | 18608 | 18160 | 3504.6 |
| C | 1 | 16 | 1695871 | 409.01 | 17930 | 17987 | 4102.3 |
| C | 14 | 67 | 369323 | 85.64 | 17930 | 17987 | 4102.3 |
| C | 9 | 54 | 200146 | 44.4 | 17930 | 17987 | 4102.3 |
| D | 12 | 227 | 8286007 | 1929.26 | 17776 | 17233 | 4286.0 |
| D | 13 | 235 | 7384782 | 1718.99 | 17776 | 17233 | 4286.0 |
| D | 2 | 136 | 3095634 | 718.25 | 17776 | 17233 | 4286.0 |
Histogram calculated using DETX and DETY for each event in the final _common_clean file
| Quadrant A | 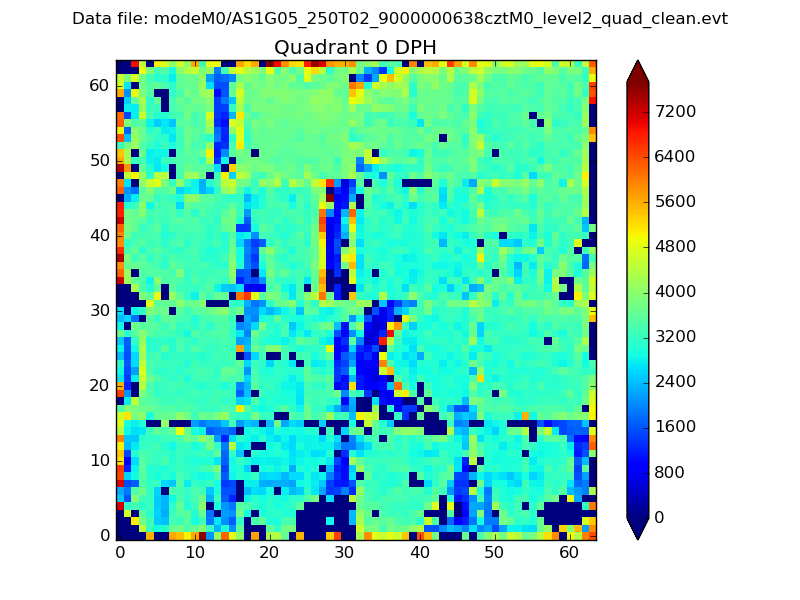 |
 |
Quadrant B |
|---|---|---|---|
| Quadrant D |  |
 |
Quadrant C |
| Plot type | Count rate plots | Images |
|---|---|---|
| Comparison with Poisson distribution Blue bars denote a histogram of data divided into 1 sec bins. Red curve is a Poisson curve with rate = median count rate of data. |
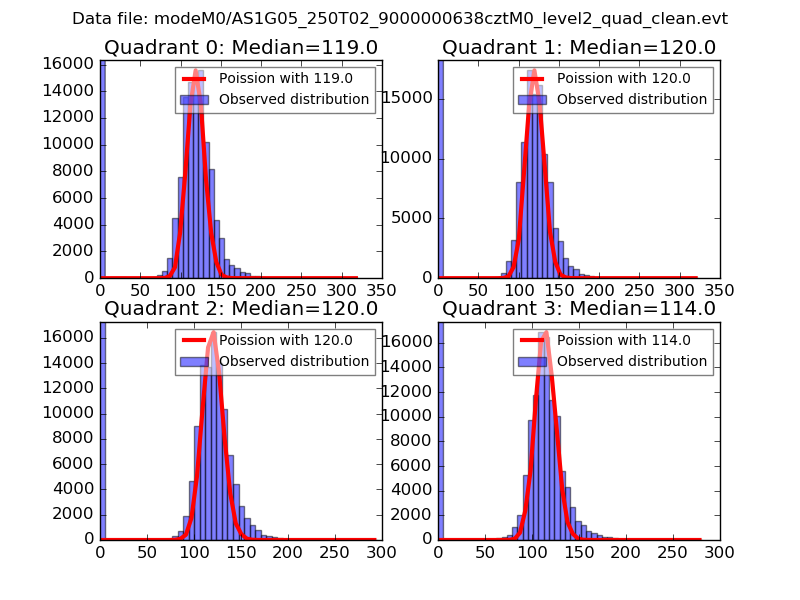 |
 |
| Quadrant-wise count rates Data is divided into 100 sec bins |
 |
|
| Module-wise count rates for Quadrant A Data is divided into 100 sec bins |
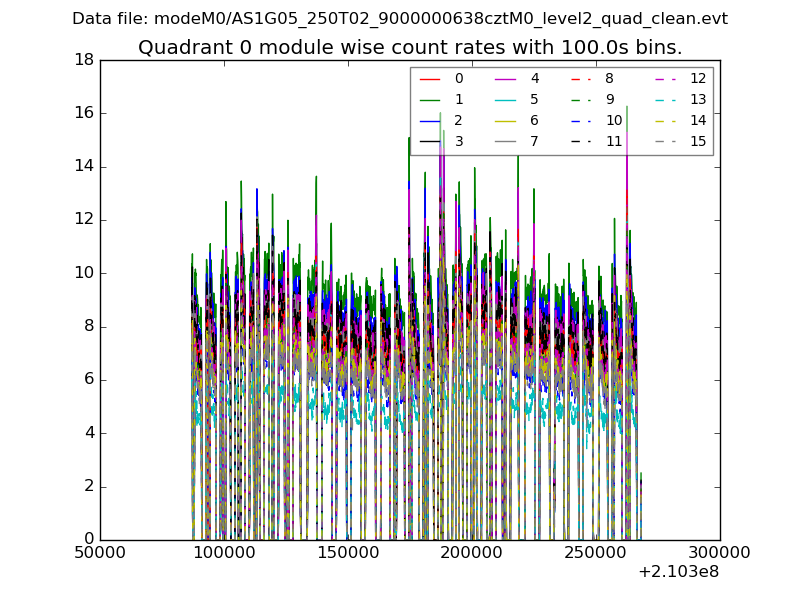 |
 |
| Module-wise count rates for Quadrant B Data is divided into 100 sec bins |
 |
 |
| Module-wise count rates for Quadrant C Data is divided into 100 sec bins |
 |
 |
| Module-wise count rates for Quadrant D Data is divided into 100 sec bins |
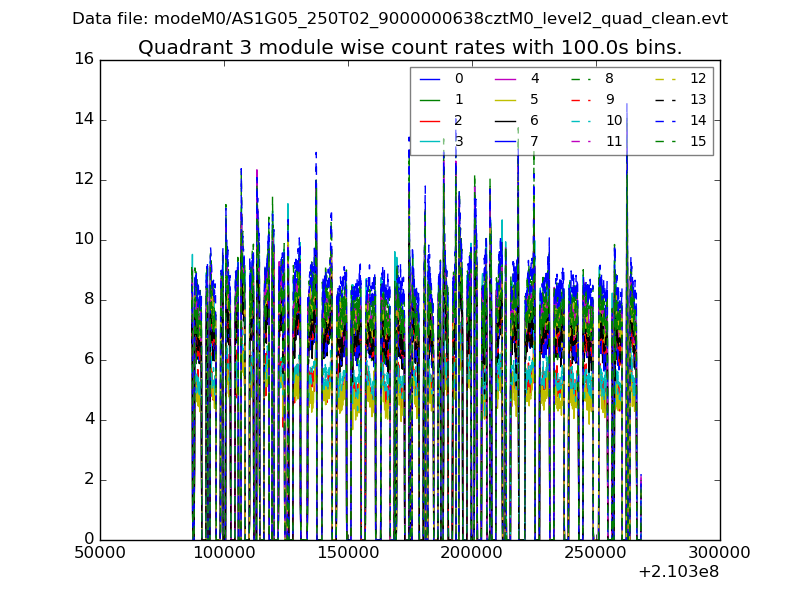 |
 |
| Parameter | Plot |
|---|---|
| CZT HV Monitor |  |
| D_VDD |  |
| Temperature 1 | 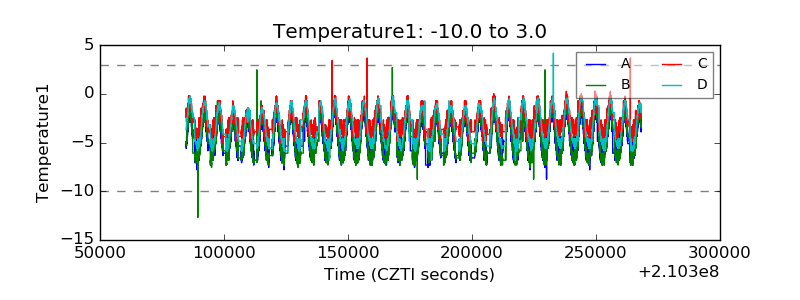 |
| Veto HV Monitor |  |
| Veto LLD |  |
| Alpha Counter |  |
| _CPM_Rate |  |
| CZT Counter |  |
| +2.5 Volts monitor |  |
| +5 Volts monitor |  |
| _ROLL_ROT |  |
| _Roll_DEC |  |
| _Roll_RA |  |
| Veto Counter |  |