| Param | Original file | Final file |
|---|---|---|
| Filename | modeM0/AS1T01_135T01_9000000632cztM0_level2_bc.evt | modeM0/AS1T01_135T01_9000000632cztM0_level2_quad_clean.evt |
| Size (bytes) | 504,368,640 | 171,999,360 |
| Size | 481.0 MB | 164.0 MB |
| Events in quadrant A | 2,961,455 | 1,085,284 |
| Events in quadrant B | 3,216,097 | 1,080,706 |
| Events in quadrant C | 2,958,333 | 1,046,410 |
| Events in quadrant D | 5,093,532 | 946,200 |
| Mode SS | |||
|---|---|---|---|
| Quadrant | BADHDUFLAG | Total packets | Discarded packets |
| A | 0 | 308 | 0 |
| B | 0 | 308 | 0 |
| C | 0 | 308 | 0 |
| D | 0 | 308 | 0 |
| Mode M0 | |||
|---|---|---|---|
| Quadrant | BADHDUFLAG | Total packets | Discarded packets |
| A | 0 | 32057 | 0 |
| B | 0 | 32903 | 0 |
| C | 0 | 32095 | 0 |
| D | 0 | 42028 | 0 |
| Mode M9 | |||
|---|---|---|---|
| Quadrant | BADHDUFLAG | Total packets | Discarded packets |
| A | 0 | 14 | 0 |
| B | 0 | 14 | 0 |
| C | 0 | 14 | 0 |
| D | 0 | 14 | 0 |
| Quadrant | Total seconds | Saturated seconds | Saturation percentage |
|---|---|---|---|
| A | 15217 | 412 | 2.707498% |
| B | 15213 | 493 | 3.240649% |
| C | 15217 | 344 | 2.260630% |
| D | 15218 | 1404 | 9.225917% |
Noise dominated data is calculated using 1-second bins in cleaned event files. If a bin has >2000 counts, and if more than 50% of those come from <1% of pixels, then it is considered to be noise-dominated and hence unusable.
| Quadrant | # 1 sec bins | Bins with >0 counts | Bins with >2000 counts | High rate bins dominated by noise | Noise dominated (total time) | Noise dominated (detector-on time) | Marked lightcurve |
|---|---|---|---|---|---|---|---|
| A | 16592 | 15214 | 0 | 0 | 0.00% | 0.00% |  |
| B | 16592 | 15210 | 0 | 0 | 0.00% | 0.00% |  |
| C | 16592 | 15215 | 0 | 0 | 0.00% | 0.00% | 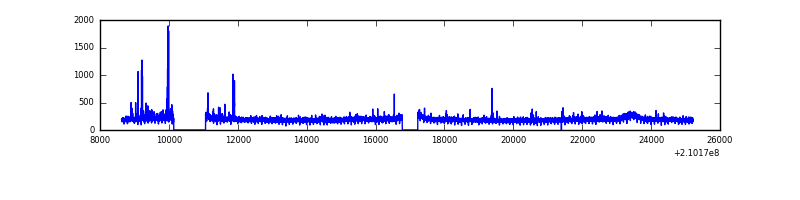 |
| D | 16592 | 15215 | 32 | 32 | 0.19% | 0.21% |  |
Top three noisy pixels from each quadrant. If the there are fewer than three noisy pixels in the level2.evt file, extra rows are filled as -1
| Pixel properties | Quadrant properties | ||||||
|---|---|---|---|---|---|---|---|
| Quadrant | DetID | PixID | Counts | Sigma | Mean | Median | Sigma |
| A | 0 | 50 | 44036 | 248.72 | 756 | 732 | 174.1 |
| A | 12 | 194 | 6422 | 32.68 | 756 | 732 | 174.1 |
| A | 8 | 15 | 5946 | 29.95 | 756 | 732 | 174.1 |
| B | 0 | 219 | 252561 | 1653.37 | 760 | 733 | 152.3 |
| B | 0 | 183 | 14152 | 88.1 | 760 | 733 | 152.3 |
| B | 15 | 54 | 9944 | 60.47 | 760 | 733 | 152.3 |
| C | 1 | 16 | 59401 | 353.66 | 735 | 719 | 165.9 |
| C | 10 | 21 | 9929 | 55.51 | 735 | 719 | 165.9 |
| C | 13 | 61 | 4794 | 24.56 | 735 | 719 | 165.9 |
| D | 13 | 235 | 1017004 | 6014.24 | 710 | 679 | 169.0 |
| D | 4 | 95 | 851884 | 5037.12 | 710 | 679 | 169.0 |
| D | 13 | 239 | 151958 | 895.21 | 710 | 679 | 169.0 |
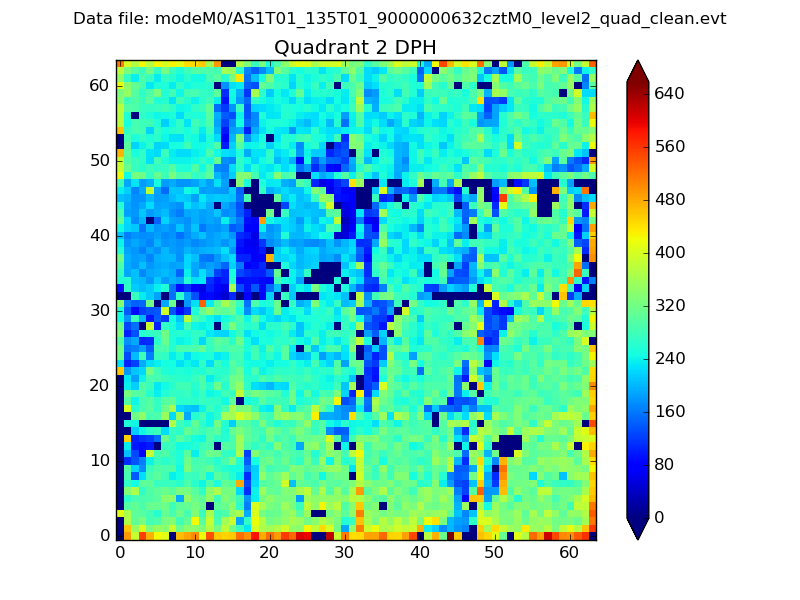
Histogram calculated using DETX and DETY for each event in the final _common_clean file
| Quadrant A |  |
 |
Quadrant B |
|---|---|---|---|
| Quadrant D |  |
 |
Quadrant C |
| Plot type | Count rate plots | Images |
|---|---|---|
| Comparison with Poisson distribution Blue bars denote a histogram of data divided into 1 sec bins. Red curve is a Poisson curve with rate = median count rate of data. |
 |
 |
| Quadrant-wise count rates Data is divided into 100 sec bins |
 |
|
| Module-wise count rates for Quadrant A Data is divided into 100 sec bins |
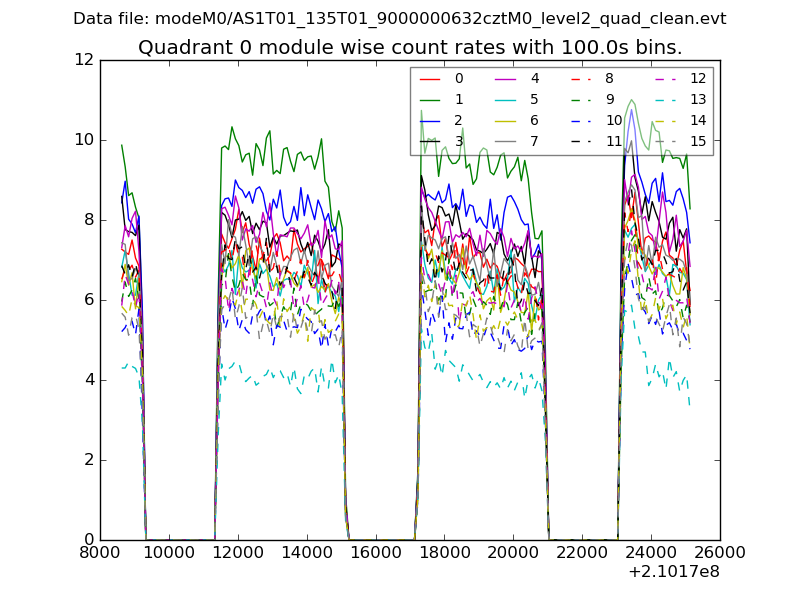 |
 |
| Module-wise count rates for Quadrant B Data is divided into 100 sec bins |
 |
 |
| Module-wise count rates for Quadrant C Data is divided into 100 sec bins |
 |
 |
| Module-wise count rates for Quadrant D Data is divided into 100 sec bins |
 |
 |
| Parameter | Plot |
|---|---|
| CZT HV Monitor |  |
| D_VDD | 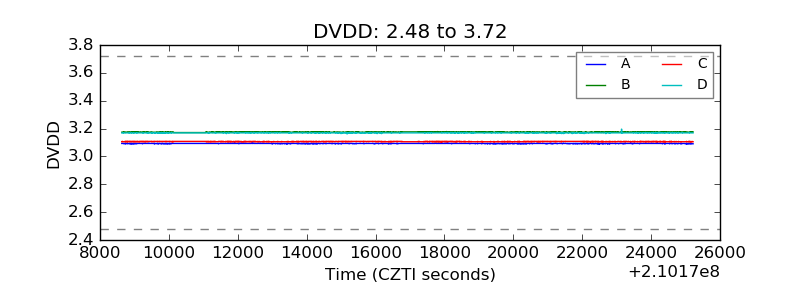 |
| Temperature 1 |  |
| Veto HV Monitor |  |
| Veto LLD |  |
| Alpha Counter | 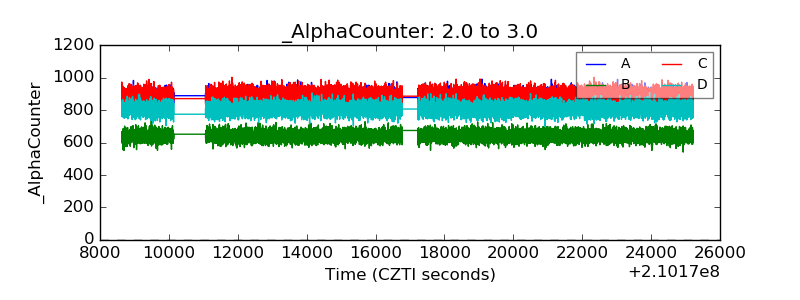 |
| _CPM_Rate |  |
| CZT Counter |  |
| +2.5 Volts monitor |  |
| +5 Volts monitor |  |
| _ROLL_ROT |  |
| _Roll_DEC | 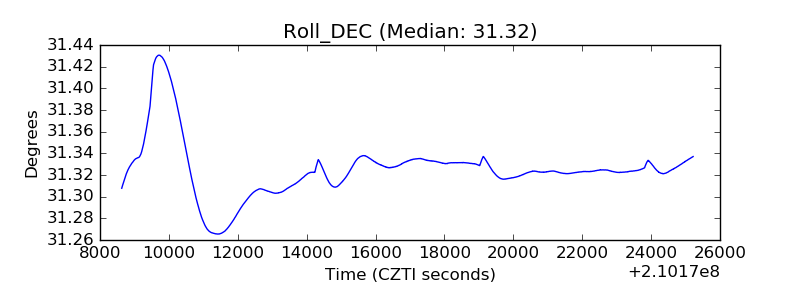 |
| _Roll_RA | 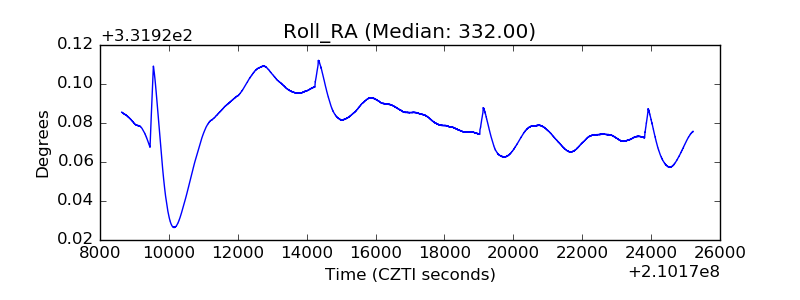 |
| Veto Counter |  |