| Param | Original file | Final file |
|---|---|---|
| Filename | modeM0/AS1G05_158T01_9000000630cztM0_level2.evt | modeM0/AS1G05_158T01_9000000630cztM0_level2_quad_clean.evt |
| Size (bytes) | 5,819,932,800 | 1,044,498,240 |
| Size | 5.4 GB | 996.1 MB |
| Events in quadrant A | 37,844,813 | 6,681,794 |
| Events in quadrant B | 40,680,696 | 6,740,761 |
| Events in quadrant C | 35,683,533 | 6,736,742 |
| Events in quadrant D | 56,769,480 | 6,109,173 |
| Mode M0 | |||
|---|---|---|---|
| Quadrant | BADHDUFLAG | Total packets | Discarded packets |
| A | 0 | 166005 | 0 |
| B | 0 | 171915 | 0 |
| C | 0 | 161391 | 0 |
| D | 0 | 223796 | 0 |
| Mode M9 | |||
|---|---|---|---|
| Quadrant | BADHDUFLAG | Total packets | Discarded packets |
| A | 0 | 133 | 0 |
| B | 0 | 133 | 0 |
| C | 0 | 133 | 0 |
| D | 0 | 133 | 0 |
| Mode SS | |||
|---|---|---|---|
| Quadrant | BADHDUFLAG | Total packets | Discarded packets |
| A | 0 | 1586 | 0 |
| B | 0 | 1586 | 0 |
| C | 0 | 1586 | 0 |
| D | 0 | 1586 | 0 |
| Quadrant | Total seconds | Saturated seconds | Saturation percentage |
|---|---|---|---|
| A | 78323 | 1099 | 1.403164% |
| B | 78323 | 1072 | 1.368691% |
| C | 78323 | 504 | 0.643489% |
| D | 78323 | 6029 | 7.697611% |
Noise dominated data is calculated using 1-second bins in cleaned event files. If a bin has >2000 counts, and if more than 50% of those come from <1% of pixels, then it is considered to be noise-dominated and hence unusable.
| Quadrant | # 1 sec bins | Bins with >0 counts | Bins with >2000 counts | High rate bins dominated by noise | Noise dominated (total time) | Noise dominated (detector-on time) | Marked lightcurve |
|---|---|---|---|---|---|---|---|
| A | 90428 | 78326 | 288 | 288 | 0.32% | 0.37% |  |
| B | 90428 | 78327 | 232 | 232 | 0.26% | 0.30% |  |
| C | 90428 | 78328 | 21 | 21 | 0.02% | 0.03% | 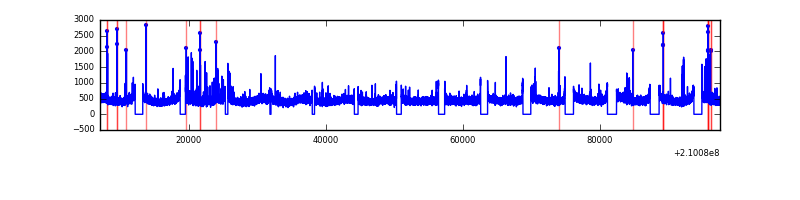 |
| D | 90428 | 78326 | 5220 | 5220 | 5.77% | 6.66% | 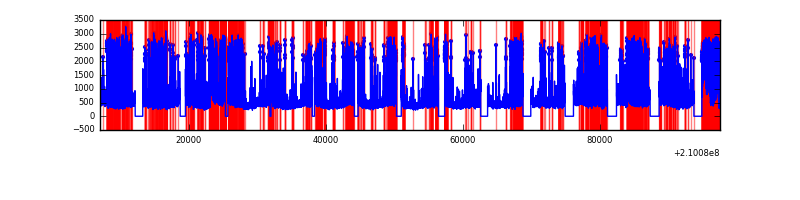 |
Top three noisy pixels from each quadrant. If the there are fewer than three noisy pixels in the level2.evt file, extra rows are filled as -1
| Pixel properties | Quadrant properties | ||||||
|---|---|---|---|---|---|---|---|
| Quadrant | DetID | PixID | Counts | Sigma | Mean | Median | Sigma |
| A | 0 | 50 | 1442737 | 760.73 | 9321 | 9135 | 1884.5 |
| A | 13 | 251 | 182271 | 91.87 | 9321 | 9135 | 1884.5 |
| A | 15 | 234 | 169289 | 84.98 | 9321 | 9135 | 1884.5 |
| B | 15 | 204 | 1903625 | 1067.52 | 9403 | 9197 | 1774.6 |
| B | 14 | 167 | 835421 | 465.58 | 9403 | 9197 | 1774.6 |
| B | 0 | 219 | 746837 | 415.67 | 9403 | 9197 | 1774.6 |
| C | 1 | 16 | 337933 | 158.49 | 9025 | 9069 | 2075.0 |
| C | 9 | 54 | 76364 | 32.43 | 9025 | 9069 | 2075.0 |
| C | 13 | 61 | 74568 | 31.57 | 9025 | 9069 | 2075.0 |
| D | 2 | 33 | 5748616 | 2700.45 | 8757 | 8497 | 2125.6 |
| D | 4 | 95 | 4299928 | 2018.91 | 8757 | 8497 | 2125.6 |
| D | 13 | 235 | 3497781 | 1641.54 | 8757 | 8497 | 2125.6 |
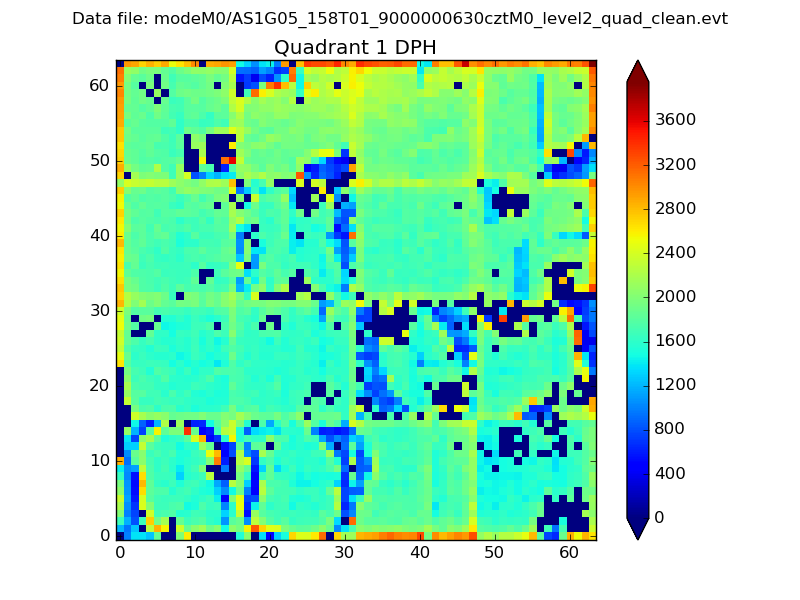
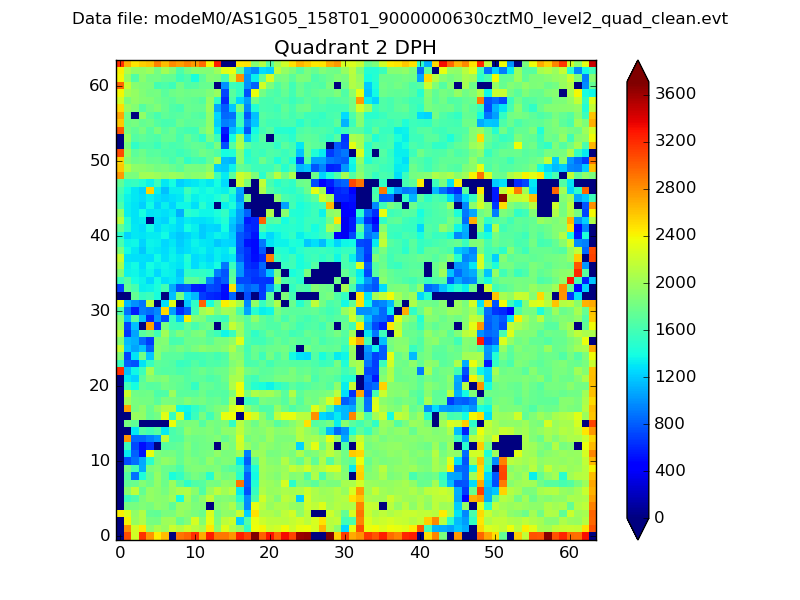
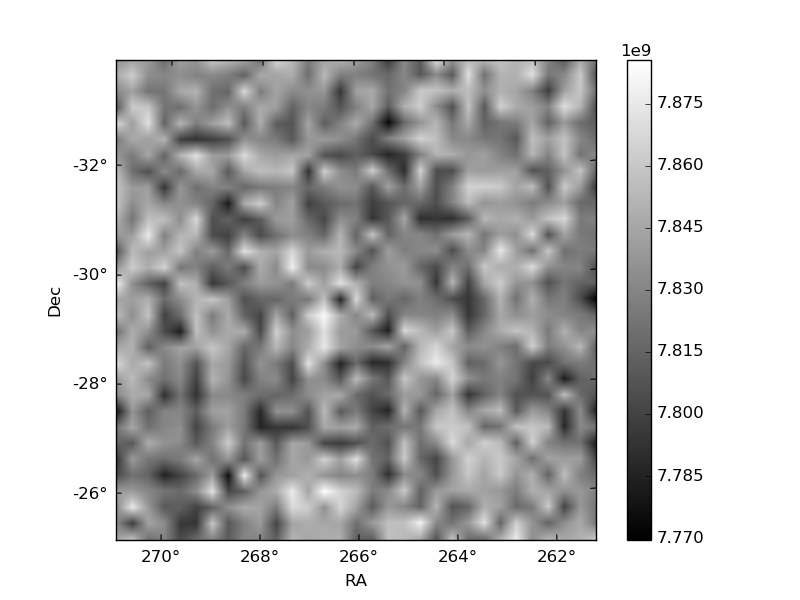
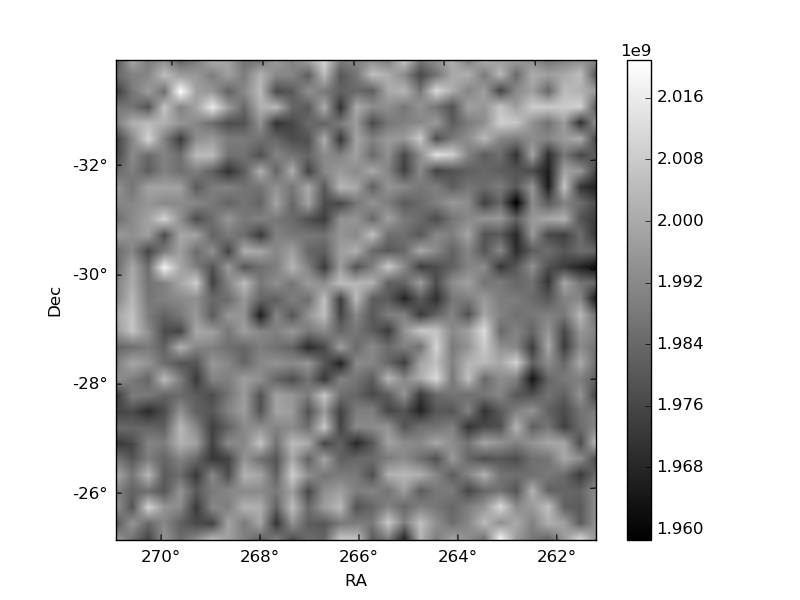
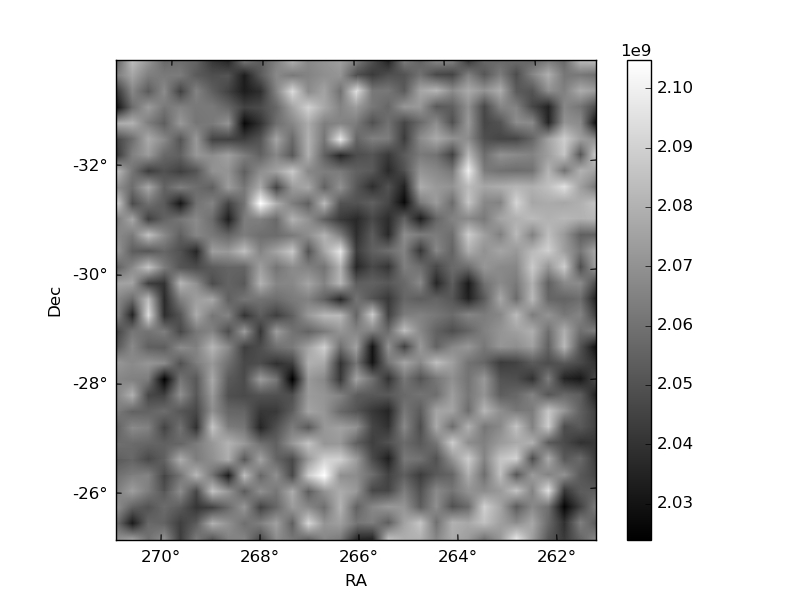
Histogram calculated using DETX and DETY for each event in the final _common_clean file
| Quadrant A |  |
 |
Quadrant B |
|---|---|---|---|
| Quadrant D |  |
 |
Quadrant C |
| Plot type | Count rate plots | Images |
|---|---|---|
| Comparison with Poisson distribution Blue bars denote a histogram of data divided into 1 sec bins. Red curve is a Poisson curve with rate = median count rate of data. |
 |
 |
| Quadrant-wise count rates Data is divided into 100 sec bins |
 |
|
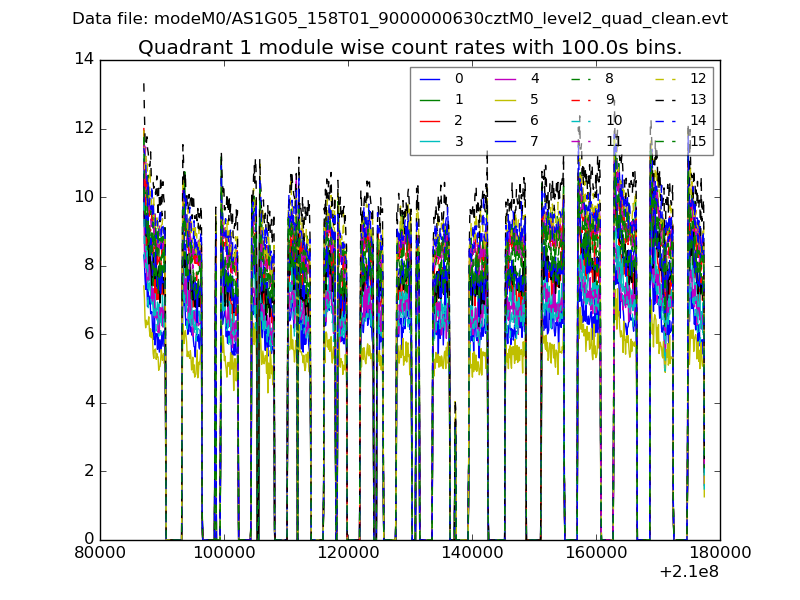
| Module-wise count rates for Quadrant A Data is divided into 100 sec bins |
 |
 |
| Module-wise count rates for Quadrant B Data is divided into 100 sec bins |
 |
 |
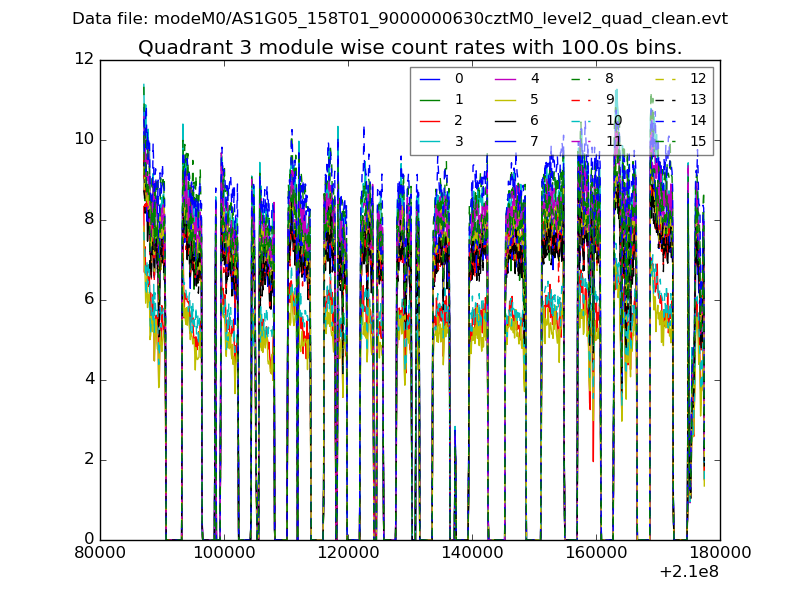
| Module-wise count rates for Quadrant C Data is divided into 100 sec bins |
 |
 |
| Module-wise count rates for Quadrant D Data is divided into 100 sec bins |
 |
 |
| Parameter | Plot |
|---|---|
| CZT HV Monitor |  |
| D_VDD | 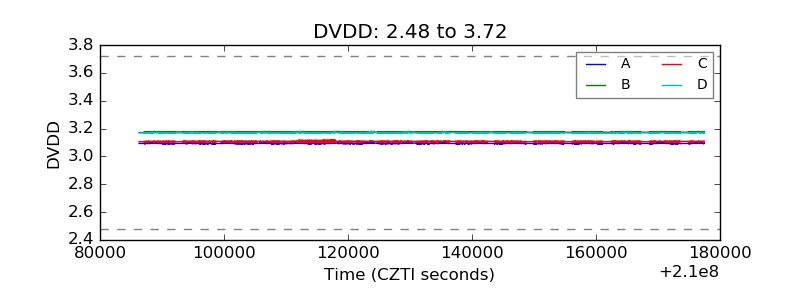 |
| Temperature 1 | 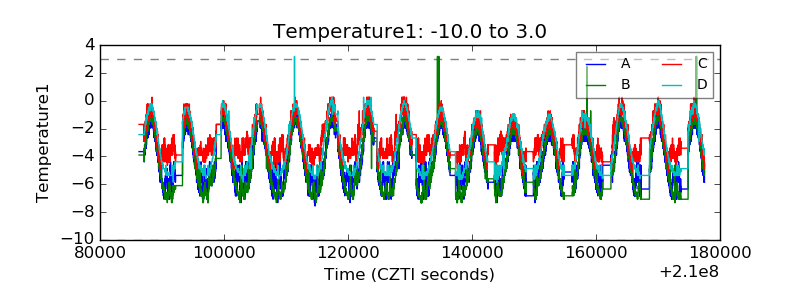 |
| Veto HV Monitor |  |
| Veto LLD |  |
| Alpha Counter |  |
| _CPM_Rate |  |
| CZT Counter | 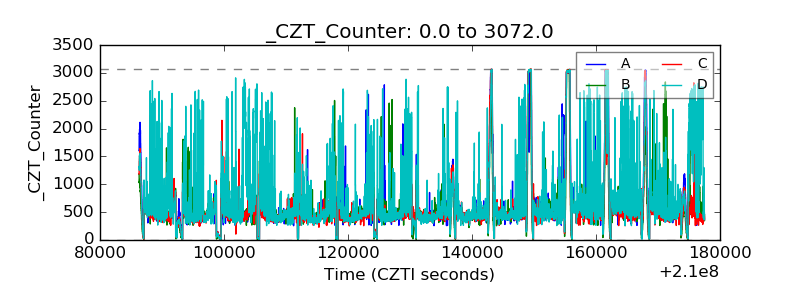 |
| +2.5 Volts monitor |  |
| +5 Volts monitor |  |
| _ROLL_ROT | 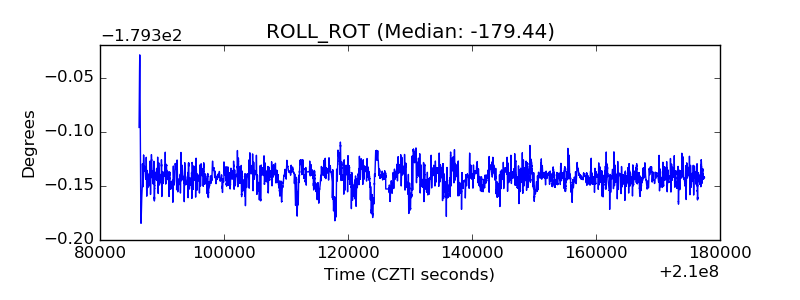 |
| _Roll_DEC |  |
| _Roll_RA |  |
| Veto Counter |  |