| Param | Original file | Final file |
|---|---|---|
| Filename | modeM0/AS1G05_140T01_9000000628cztM0_level2_bc.evt | modeM0/AS1G05_140T01_9000000628cztM0_level2_quad_clean.evt |
| Size (bytes) | 1,213,283,520 | 476,015,040 |
| Size | 1.1 GB | 454.0 MB |
| Events in quadrant A | 7,639,157 | 3,026,949 |
| Events in quadrant B | 8,086,077 | 3,008,995 |
| Events in quadrant C | 7,045,686 | 3,045,487 |
| Events in quadrant D | 11,536,841 | 2,885,602 |
| Mode M0 | |||
|---|---|---|---|
| Quadrant | BADHDUFLAG | Total packets | Discarded packets |
| A | 0 | 74841 | 0 |
| B | 0 | 75896 | 0 |
| C | 0 | 73276 | 0 |
| D | 0 | 88892 | 0 |
| Mode M9 | |||
|---|---|---|---|
| Quadrant | BADHDUFLAG | Total packets | Discarded packets |
| A | 0 | 64 | 0 |
| B | 0 | 64 | 0 |
| C | 0 | 64 | 0 |
| D | 0 | 64 | 0 |
| Mode SS | |||
|---|---|---|---|
| Quadrant | BADHDUFLAG | Total packets | Discarded packets |
| A | 0 | 726 | 0 |
| B | 0 | 726 | 0 |
| C | 0 | 726 | 0 |
| D | 0 | 726 | 0 |
| Quadrant | Total seconds | Saturated seconds | Saturation percentage |
|---|---|---|---|
| A | 35685 | 458 | 1.283452% |
| B | 35685 | 442 | 1.238616% |
| C | 35685 | 352 | 0.986409% |
| D | 35685 | 1036 | 2.903181% |
Noise dominated data is calculated using 1-second bins in cleaned event files. If a bin has >2000 counts, and if more than 50% of those come from <1% of pixels, then it is considered to be noise-dominated and hence unusable.
| Quadrant | # 1 sec bins | Bins with >0 counts | Bins with >2000 counts | High rate bins dominated by noise | Noise dominated (total time) | Noise dominated (detector-on time) | Marked lightcurve |
|---|---|---|---|---|---|---|---|
| A | 42144 | 35680 | 5 | 5 | 0.01% | 0.01% | 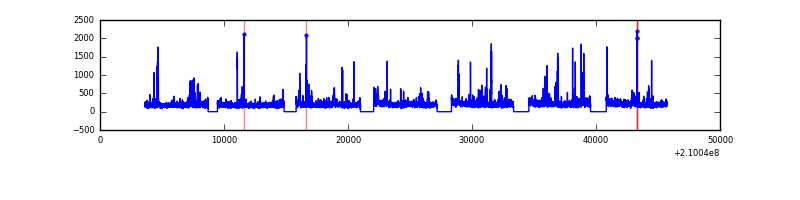 |
| B | 42145 | 35681 | 1 | 1 | 0.00% | 0.00% |  |
| C | 42145 | 35681 | 1 | 1 | 0.00% | 0.00% |  |
| D | 42145 | 35681 | 84 | 84 | 0.20% | 0.24% |  |
Top three noisy pixels from each quadrant. If the there are fewer than three noisy pixels in the level2.evt file, extra rows are filled as -1
| Pixel properties | Quadrant properties | ||||||
|---|---|---|---|---|---|---|---|
| Quadrant | DetID | PixID | Counts | Sigma | Mean | Median | Sigma |
| A | 13 | 251 | 242555 | 599.83 | 1813 | 1780 | 401.4 |
| A | 4 | 2 | 126861 | 311.61 | 1813 | 1780 | 401.4 |
| A | 0 | 50 | 103289 | 252.88 | 1813 | 1780 | 401.4 |
| B | 15 | 204 | 569537 | 1640.87 | 1817 | 1769 | 346.0 |
| B | 4 | 48 | 119294 | 339.65 | 1817 | 1769 | 346.0 |
| B | 15 | 54 | 113203 | 322.05 | 1817 | 1769 | 346.0 |
| C | 1 | 16 | 61558 | 151.38 | 1779 | 1757 | 395.0 |
| C | 13 | 61 | 11784 | 25.38 | 1779 | 1757 | 395.0 |
| C | 8 | 128 | 9428 | 19.42 | 1779 | 1757 | 395.0 |
| D | 2 | 33 | 1131904 | 2693.02 | 1777 | 1709 | 419.7 |
| D | 1 | 7 | 1003152 | 2386.23 | 1777 | 1709 | 419.7 |
| D | 2 | 136 | 725196 | 1723.92 | 1777 | 1709 | 419.7 |
Histogram calculated using DETX and DETY for each event in the final _common_clean file
| Quadrant A | 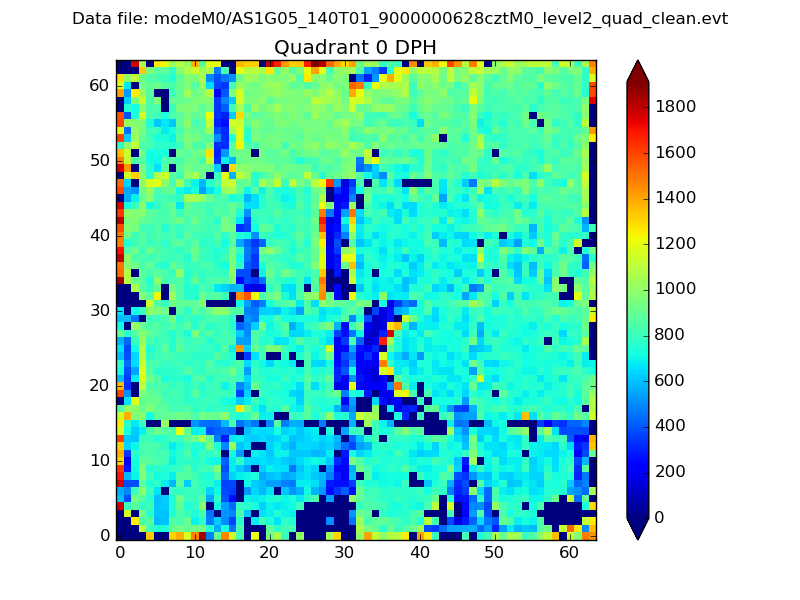 |
 |
Quadrant B |
|---|---|---|---|
| Quadrant D |  |
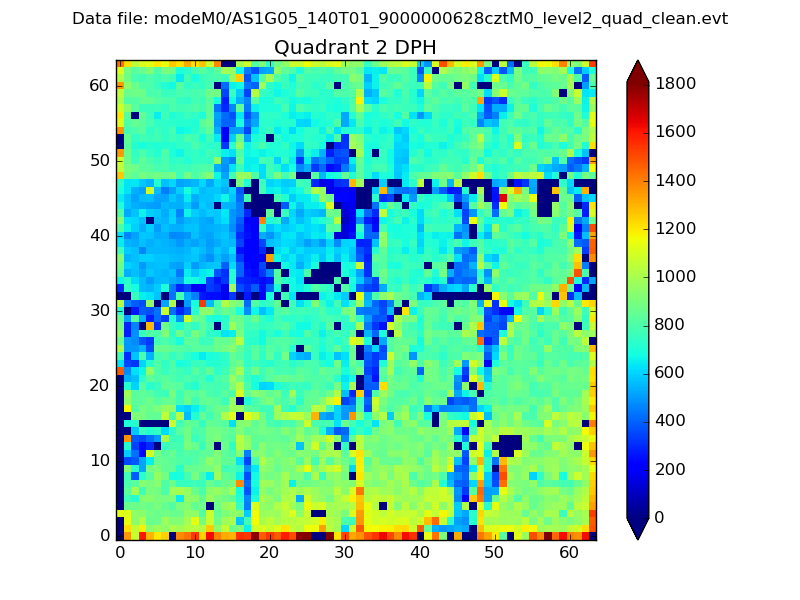 |
Quadrant C |
| Plot type | Count rate plots | Images |
|---|---|---|
| Comparison with Poisson distribution Blue bars denote a histogram of data divided into 1 sec bins. Red curve is a Poisson curve with rate = median count rate of data. |
 |
 |
| Quadrant-wise count rates Data is divided into 100 sec bins |
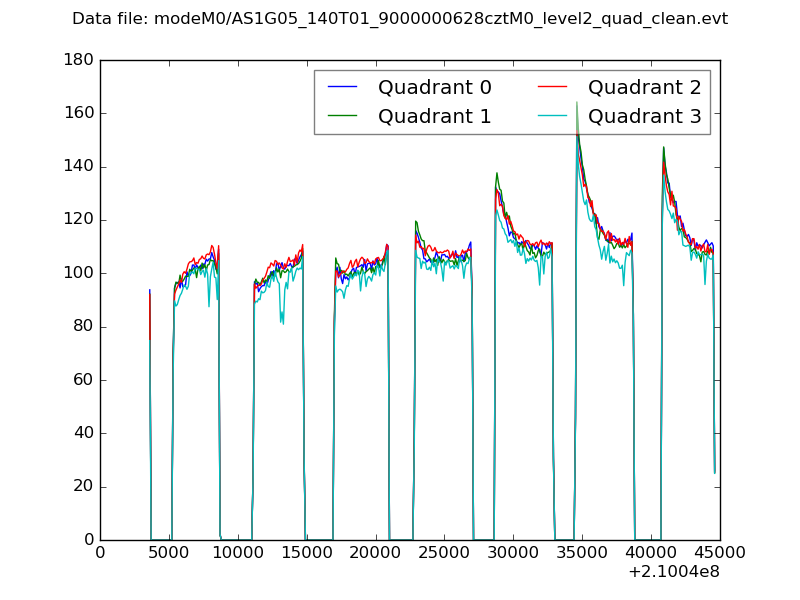 |
|
| Module-wise count rates for Quadrant A Data is divided into 100 sec bins |
 |
 |
| Module-wise count rates for Quadrant B Data is divided into 100 sec bins |
 |
 |
| Module-wise count rates for Quadrant C Data is divided into 100 sec bins |
 |
 |
| Module-wise count rates for Quadrant D Data is divided into 100 sec bins |
 |
 |
| Parameter | Plot |
|---|---|
| CZT HV Monitor |  |
| D_VDD |  |
| Temperature 1 |  |
| Veto HV Monitor |  |
| Veto LLD | 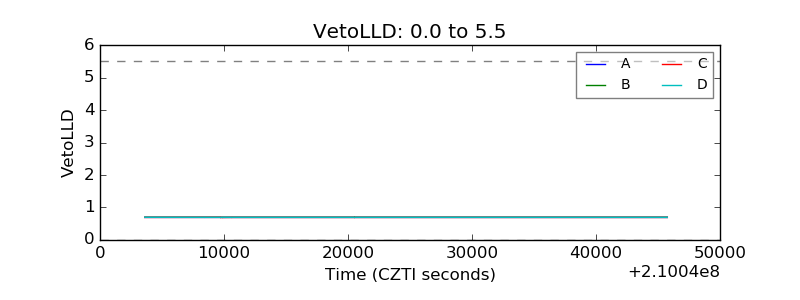 |
| Alpha Counter |  |
| _CPM_Rate |  |
| CZT Counter | 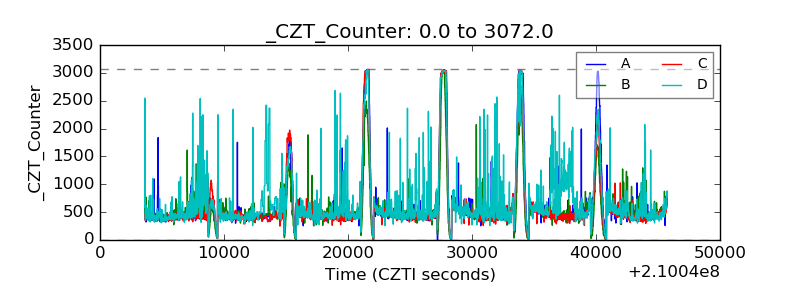 |
| +2.5 Volts monitor |  |
| +5 Volts monitor |  |
| _ROLL_ROT |  |
| _Roll_DEC |  |
| _Roll_RA |  |
| Veto Counter |  |