| Param | Original file | Final file |
|---|---|---|
| Filename | modeM0/AS1G05_157T01_9000000626cztM0_level2_bc.evt | modeM0/AS1G05_157T01_9000000626cztM0_level2_quad_clean.evt |
| Size (bytes) | 2,969,464,320 | 917,778,240 |
| Size | 2.8 GB | 875.3 MB |
| Events in quadrant A | 22,605,087 | 5,567,353 |
| Events in quadrant B | 18,413,639 | 5,790,016 |
| Events in quadrant C | 14,451,842 | 5,827,159 |
| Events in quadrant D | 29,309,868 | 5,430,025 |
| Mode M9 | |||
|---|---|---|---|
| Quadrant | BADHDUFLAG | Total packets | Discarded packets |
| A | 0 | 115 | 0 |
| B | 0 | 115 | 0 |
| C | 0 | 115 | 0 |
| D | 0 | 115 | 0 |
| Mode SS | |||
|---|---|---|---|
| Quadrant | BADHDUFLAG | Total packets | Discarded packets |
| A | 0 | 1544 | 0 |
| B | 0 | 1544 | 0 |
| C | 0 | 1544 | 0 |
| D | 0 | 1542 | 0 |
| Mode M0 | |||
|---|---|---|---|
| Quadrant | BADHDUFLAG | Total packets | Discarded packets |
| A | 0 | 189727 | 0 |
| B | 0 | 166005 | 0 |
| C | 0 | 154659 | 0 |
| D | 0 | 210175 | 0 |
| Quadrant | Total seconds | Saturated seconds | Saturation percentage |
|---|---|---|---|
| A | 75569 | 4842 | 6.407389% |
| B | 75565 | 1413 | 1.869913% |
| C | 75565 | 520 | 0.688149% |
| D | 75562 | 4471 | 5.916995% |
Noise dominated data is calculated using 1-second bins in cleaned event files. If a bin has >2000 counts, and if more than 50% of those come from <1% of pixels, then it is considered to be noise-dominated and hence unusable.
| Quadrant | # 1 sec bins | Bins with >0 counts | Bins with >2000 counts | High rate bins dominated by noise | Noise dominated (total time) | Noise dominated (detector-on time) | Marked lightcurve |
|---|---|---|---|---|---|---|---|
| A | 87163 | 75553 | 1008 | 1008 | 1.16% | 1.33% |  |
| B | 87163 | 75562 | 114 | 114 | 0.13% | 0.15% |  |
| C | 87163 | 75566 | 0 | 0 | 0.00% | 0.00% |  |
| D | 87163 | 75560 | 467 | 467 | 0.54% | 0.62% |  |
Top three noisy pixels from each quadrant. If the there are fewer than three noisy pixels in the level2.evt file, extra rows are filled as -1
| Pixel properties | Quadrant properties | ||||||
|---|---|---|---|---|---|---|---|
| Quadrant | DetID | PixID | Counts | Sigma | Mean | Median | Sigma |
| A | 0 | 31 | 6833960 | 8543.55 | 3596 | 3520 | 799.5 |
| A | 0 | 50 | 800435 | 996.79 | 3596 | 3520 | 799.5 |
| A | 13 | 251 | 509220 | 632.53 | 3596 | 3520 | 799.5 |
| B | 10 | 16 | 1887866 | 2636.62 | 3733 | 3634 | 714.6 |
| B | 15 | 204 | 728032 | 1013.66 | 3733 | 3634 | 714.6 |
| B | 8 | 3 | 392839 | 544.62 | 3733 | 3634 | 714.6 |
| C | 14 | 67 | 58561 | 67.95 | 3644 | 3594 | 809.0 |
| C | 12 | 4 | 52047 | 59.89 | 3644 | 3594 | 809.0 |
| C | 1 | 16 | 36595 | 40.79 | 3644 | 3594 | 809.0 |
| D | 2 | 33 | 5806103 | 6760.48 | 3585 | 3443 | 858.3 |
| D | 1 | 7 | 2248389 | 2615.51 | 3585 | 3443 | 858.3 |
| D | 13 | 235 | 1980402 | 2303.29 | 3585 | 3443 | 858.3 |
Histogram calculated using DETX and DETY for each event in the final _common_clean file
| Quadrant A |  |
 |
Quadrant B |
|---|---|---|---|
| Quadrant D |  |
 |
Quadrant C |
| Plot type | Count rate plots | Images |
|---|---|---|
| Comparison with Poisson distribution Blue bars denote a histogram of data divided into 1 sec bins. Red curve is a Poisson curve with rate = median count rate of data. |
 |
 |
| Quadrant-wise count rates Data is divided into 100 sec bins |
 |
|
| Module-wise count rates for Quadrant A Data is divided into 100 sec bins |
 |
 |
| Module-wise count rates for Quadrant B Data is divided into 100 sec bins |
 |
 |
| Module-wise count rates for Quadrant C Data is divided into 100 sec bins |
 |
 |
| Module-wise count rates for Quadrant D Data is divided into 100 sec bins |
 |
 |
| Parameter | Plot |
|---|---|
| CZT HV Monitor |  |
| D_VDD |  |
| Temperature 1 |  |
| Veto HV Monitor |  |
| Veto LLD |  |
| Alpha Counter |  |
| _CPM_Rate |  |
| CZT Counter |  |
| +2.5 Volts monitor |  |
| +5 Volts monitor |  |
| _ROLL_ROT | 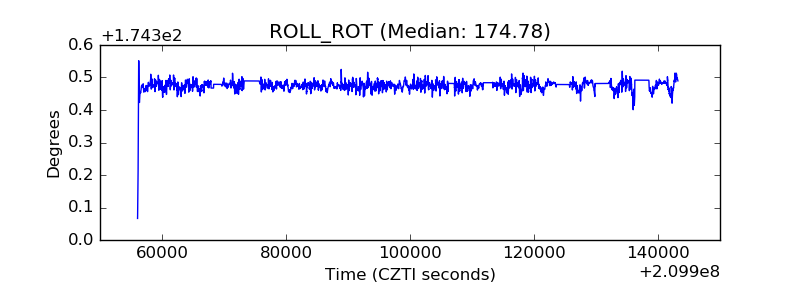 |
| _Roll_DEC |  |
| _Roll_RA |  |
| Veto Counter |  |