| Param | Original file | Final file |
|---|---|---|
| Filename | modeM0/AS1G05_021T01_9000000624cztM0_level2.evt | modeM0/AS1G05_021T01_9000000624cztM0_level2_quad_clean.evt |
| Size (bytes) | 5,352,825,600 | 886,674,240 |
| Size | 5.0 GB | 845.6 MB |
| Events in quadrant A | 47,942,529 | 5,295,757 |
| Events in quadrant B | 25,241,092 | 6,326,109 |
| Events in quadrant C | 52,316,964 | 5,745,307 |
| Events in quadrant D | 33,132,013 | 5,931,528 |
| Mode M0 | |||
|---|---|---|---|
| Quadrant | BADHDUFLAG | Total packets | Discarded packets |
| A | 0 | 178060 | 0 |
| B | 0 | 109923 | 0 |
| C | 0 | 191998 | 0 |
| D | 0 | 134664 | 0 |
| Mode SS | |||
|---|---|---|---|
| Quadrant | BADHDUFLAG | Total packets | Discarded packets |
| A | 0 | 1142 | 0 |
| B | 0 | 1142 | 0 |
| C | 0 | 1142 | 0 |
| D | 0 | 1142 | 0 |
| Mode M9 | |||
|---|---|---|---|
| Quadrant | BADHDUFLAG | Total packets | Discarded packets |
| A | 0 | 92 | 0 |
| B | 0 | 92 | 0 |
| C | 0 | 92 | 0 |
| D | 0 | 92 | 0 |
| Quadrant | Total seconds | Saturated seconds | Saturation percentage |
|---|---|---|---|
| A | 51457 | 10933 | 21.246866% |
| B | 51457 | 635 | 1.234040% |
| C | 51457 | 9218 | 17.913986% |
| D | 51457 | 2075 | 4.032493% |
Noise dominated data is calculated using 1-second bins in cleaned event files. If a bin has >2000 counts, and if more than 50% of those come from <1% of pixels, then it is considered to be noise-dominated and hence unusable.
| Quadrant | # 1 sec bins | Bins with >0 counts | Bins with >2000 counts | High rate bins dominated by noise | Noise dominated (total time) | Noise dominated (detector-on time) | Marked lightcurve |
|---|---|---|---|---|---|---|---|
| A | 70581 | 51462 | 9734 | 9734 | 13.79% | 18.91% |  |
| B | 70580 | 51462 | 113 | 113 | 0.16% | 0.22% |  |
| C | 70581 | 51464 | 8811 | 8811 | 12.48% | 17.12% |  |
| D | 70581 | 51464 | 1657 | 1657 | 2.35% | 3.22% |  |
Top three noisy pixels from each quadrant. If the there are fewer than three noisy pixels in the level2.evt file, extra rows are filled as -1
| Pixel properties | Quadrant properties | ||||||
|---|---|---|---|---|---|---|---|
| Quadrant | DetID | PixID | Counts | Sigma | Mean | Median | Sigma |
| A | 0 | 31 | 27496029 | 26571.1 | 5137 | 5026 | 1034.6 |
| A | 0 | 50 | 440122 | 420.54 | 5137 | 5026 | 1034.6 |
| A | 13 | 251 | 124605 | 115.58 | 5137 | 5026 | 1034.6 |
| B | 15 | 204 | 777217 | 692.7 | 5987 | 5854 | 1113.6 |
| B | 0 | 219 | 381044 | 336.93 | 5987 | 5854 | 1113.6 |
| B | 10 | 16 | 261800 | 229.84 | 5987 | 5854 | 1113.6 |
| C | 9 | 247 | 30860563 | 25068.16 | 5413 | 5427 | 1230.8 |
| C | 1 | 16 | 248724 | 197.67 | 5413 | 5427 | 1230.8 |
| C | 13 | 61 | 44390 | 31.66 | 5413 | 5427 | 1230.8 |
| D | 2 | 33 | 4863928 | 3548.48 | 5694 | 5525 | 1369.2 |
| D | 12 | 22 | 944811 | 686.03 | 5694 | 5525 | 1369.2 |
| D | 2 | 136 | 927568 | 673.44 | 5694 | 5525 | 1369.2 |
Histogram calculated using DETX and DETY for each event in the final _common_clean file
| Quadrant A |  |
 |
Quadrant B |
|---|---|---|---|
| Quadrant D |  |
 |
Quadrant C |
| Plot type | Count rate plots | Images |
|---|---|---|
| Comparison with Poisson distribution Blue bars denote a histogram of data divided into 1 sec bins. Red curve is a Poisson curve with rate = median count rate of data. |
 |
 |
| Quadrant-wise count rates Data is divided into 100 sec bins |
 |
|
| Module-wise count rates for Quadrant A Data is divided into 100 sec bins |
 |
 |
| Module-wise count rates for Quadrant B Data is divided into 100 sec bins |
 |
 |
| Module-wise count rates for Quadrant C Data is divided into 100 sec bins |
 |
 |
| Module-wise count rates for Quadrant D Data is divided into 100 sec bins |
 |
 |
| Parameter | Plot |
|---|---|
| CZT HV Monitor |  |
| D_VDD |  |
| Temperature 1 |  |
| Veto HV Monitor | 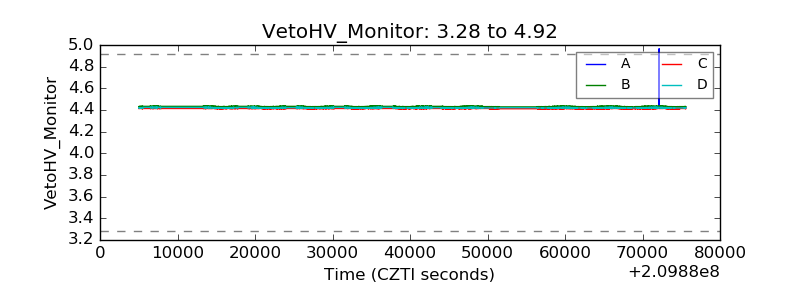 |
| Veto LLD |  |
| Alpha Counter |  |
| _CPM_Rate |  |
| CZT Counter |  |
| +2.5 Volts monitor |  |
| +5 Volts monitor | 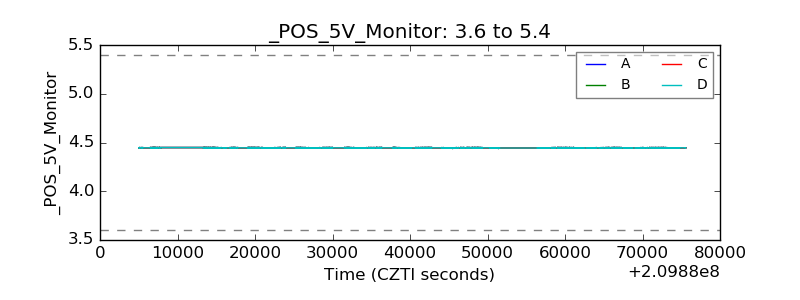 |
| _ROLL_ROT |  |
| _Roll_DEC |  |
| _Roll_RA | 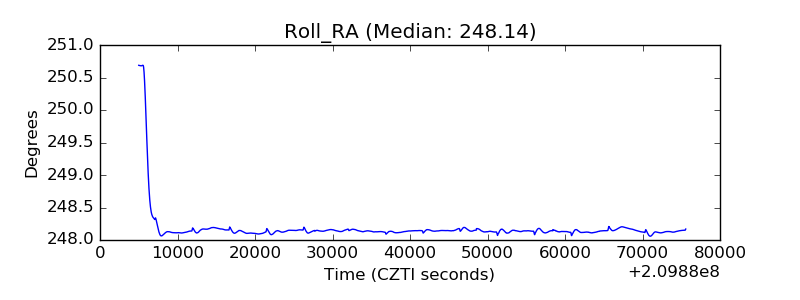 |
| Veto Counter |  |