| Param | Original file | Final file |
|---|---|---|
| Filename | modeM0/AS1G05_118T01_9000000622cztM0_level2.evt | modeM0/AS1G05_118T01_9000000622cztM0_level2_quad_clean.evt |
| Size (bytes) | 8,755,827,840 | 1,520,369,280 |
| Size | 8.2 GB | 1.4 GB |
| Events in quadrant A | 53,576,280 | 9,745,494 |
| Events in quadrant B | 54,998,534 | 9,888,553 |
| Events in quadrant C | 61,737,138 | 9,709,991 |
| Events in quadrant D | 87,398,134 | 9,116,073 |
| Mode M0 | |||
|---|---|---|---|
| Quadrant | BADHDUFLAG | Total packets | Discarded packets |
| A | 0 | 236781 | 0 |
| B | 0 | 239700 | 0 |
| C | 0 | 263259 | 0 |
| D | 0 | 336634 | 0 |
| Mode M9 | |||
|---|---|---|---|
| Quadrant | BADHDUFLAG | Total packets | Discarded packets |
| A | 0 | 142 | 0 |
| B | 0 | 142 | 0 |
| C | 0 | 142 | 0 |
| D | 0 | 143 | 0 |
| Mode SS | |||
|---|---|---|---|
| Quadrant | BADHDUFLAG | Total packets | Discarded packets |
| A | 0 | 2256 | 0 |
| B | 0 | 2256 | 0 |
| C | 0 | 2256 | 0 |
| D | 0 | 2256 | 0 |
| Quadrant | Total seconds | Saturated seconds | Saturation percentage |
|---|---|---|---|
| A | 110741 | 1838 | 1.659729% |
| B | 110743 | 1609 | 1.452914% |
| C | 110742 | 4180 | 3.774539% |
| D | 110740 | 10216 | 9.225212% |
Noise dominated data is calculated using 1-second bins in cleaned event files. If a bin has >2000 counts, and if more than 50% of those come from <1% of pixels, then it is considered to be noise-dominated and hence unusable.
| Quadrant | # 1 sec bins | Bins with >0 counts | Bins with >2000 counts | High rate bins dominated by noise | Noise dominated (total time) | Noise dominated (detector-on time) | Marked lightcurve |
|---|---|---|---|---|---|---|---|
| A | 129719 | 110761 | 616 | 616 | 0.47% | 0.56% | 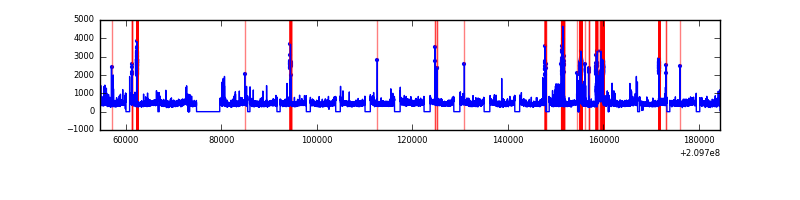 |
| B | 129719 | 110763 | 441 | 441 | 0.34% | 0.40% |  |
| C | 129719 | 110762 | 3215 | 3215 | 2.48% | 2.90% |  |
| D | 129719 | 110757 | 8371 | 8371 | 6.45% | 7.56% |  |
Top three noisy pixels from each quadrant. If the there are fewer than three noisy pixels in the level2.evt file, extra rows are filled as -1
| Pixel properties | Quadrant properties | ||||||
|---|---|---|---|---|---|---|---|
| Quadrant | DetID | PixID | Counts | Sigma | Mean | Median | Sigma |
| A | 0 | 31 | 4305812 | 1705.47 | 12563 | 12288 | 2517.5 |
| A | 13 | 251 | 266883 | 101.13 | 12563 | 12288 | 2517.5 |
| A | 15 | 174 | 234307 | 88.19 | 12563 | 12288 | 2517.5 |
| B | 10 | 16 | 2180384 | 915.37 | 12687 | 12397 | 2368.4 |
| B | 8 | 3 | 752496 | 312.49 | 12687 | 12397 | 2368.4 |
| B | 15 | 204 | 590535 | 244.1 | 12687 | 12397 | 2368.4 |
| C | 9 | 247 | 13798173 | 4954.49 | 12154 | 12192 | 2782.5 |
| C | 1 | 16 | 330337 | 114.34 | 12154 | 12192 | 2782.5 |
| C | 13 | 61 | 99804 | 31.49 | 12154 | 12192 | 2782.5 |
| D | 2 | 33 | 11050401 | 3838.56 | 11911 | 11546 | 2875.8 |
| D | 2 | 63 | 9710747 | 3372.72 | 11911 | 11546 | 2875.8 |
| D | 1 | 7 | 9256099 | 3214.62 | 11911 | 11546 | 2875.8 |
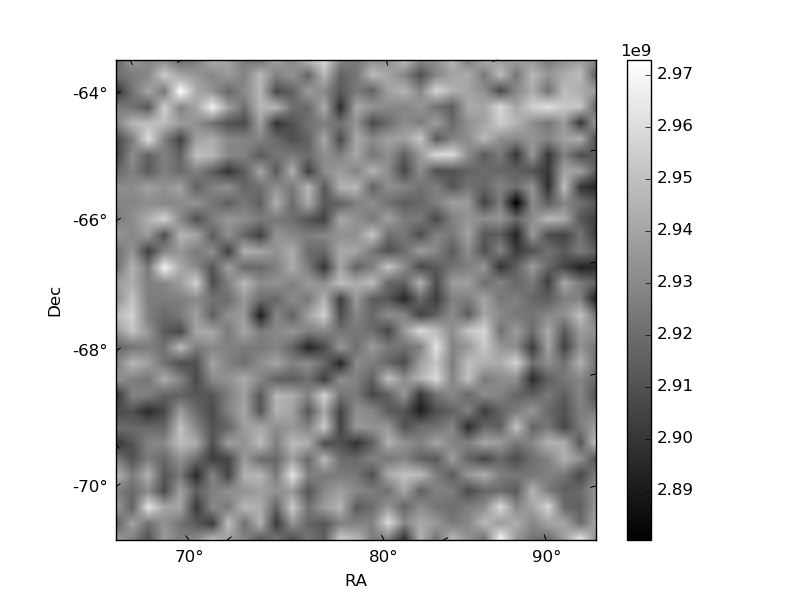
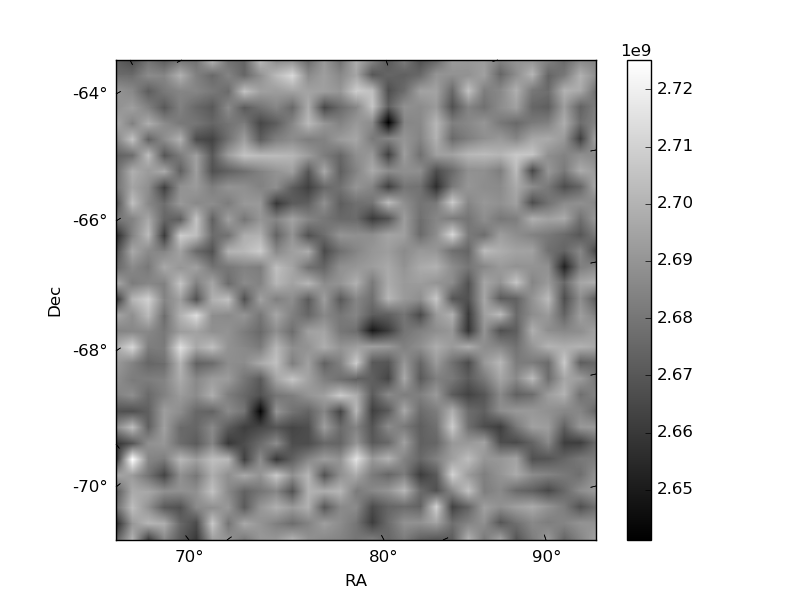
Histogram calculated using DETX and DETY for each event in the final _common_clean file
| Quadrant A |  |
 |
Quadrant B |
|---|---|---|---|
| Quadrant D |  |
 |
Quadrant C |
| Plot type | Count rate plots | Images |
|---|---|---|
| Comparison with Poisson distribution Blue bars denote a histogram of data divided into 1 sec bins. Red curve is a Poisson curve with rate = median count rate of data. |
 |
 |
| Quadrant-wise count rates Data is divided into 100 sec bins |
 |
|
| Module-wise count rates for Quadrant A Data is divided into 100 sec bins |
 |
 |
| Module-wise count rates for Quadrant B Data is divided into 100 sec bins |
 |
 |
| Module-wise count rates for Quadrant C Data is divided into 100 sec bins |
 |
 |
| Module-wise count rates for Quadrant D Data is divided into 100 sec bins |
 |
 |
| Parameter | Plot |
|---|---|
| CZT HV Monitor |  |
| D_VDD |  |
| Temperature 1 |  |
| Veto HV Monitor |  |
| Veto LLD |  |
| Alpha Counter | 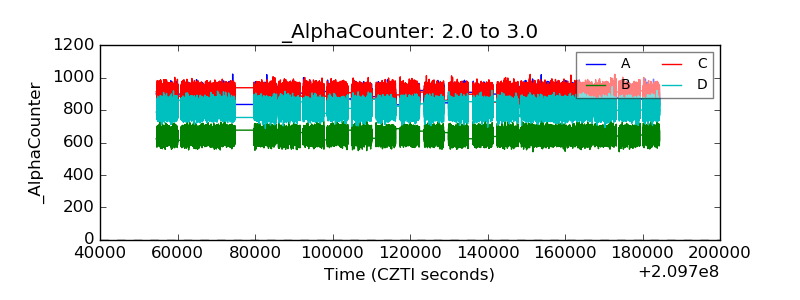 |
| _CPM_Rate | 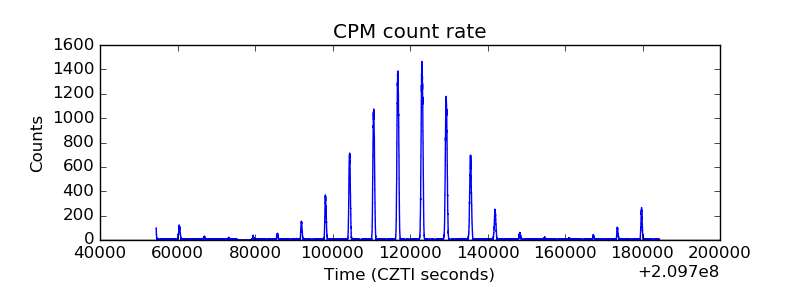 |
| CZT Counter |  |
| +2.5 Volts monitor | 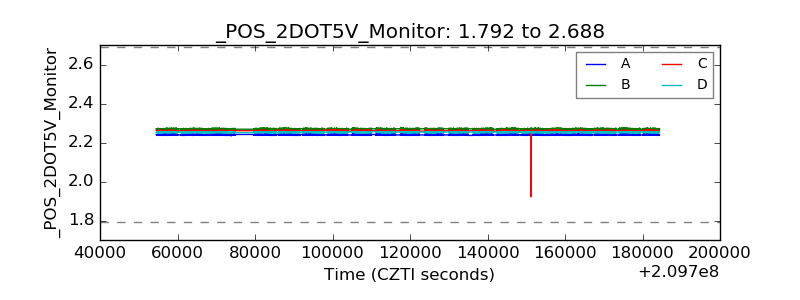 |
| +5 Volts monitor |  |
| _ROLL_ROT |  |
| _Roll_DEC |  |
| _Roll_RA |  |
| Veto Counter | 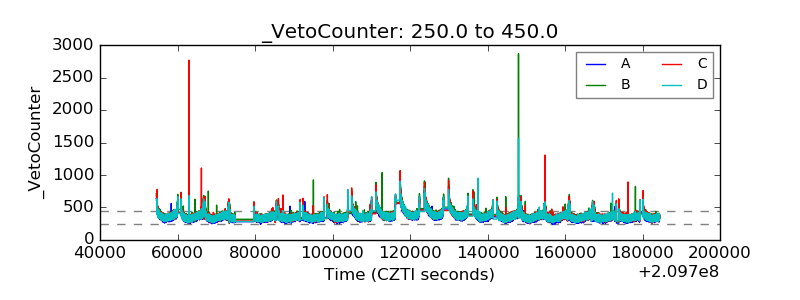 |