| Param | Original file | Final file |
|---|---|---|
| Filename | modeM0/AS1G05_237T01_9000000620cztM0_level2.evt | modeM0/AS1G05_237T01_9000000620cztM0_level2_quad_clean.evt |
| Size (bytes) | 13,583,750,400 | 1,865,378,880 |
| Size | 12.7 GB | 1.7 GB |
| Events in quadrant A | 76,627,663 | 12,134,008 |
| Events in quadrant B | 79,426,737 | 12,234,035 |
| Events in quadrant C | 69,684,377 | 12,120,208 |
| Events in quadrant D | 175,552,515 | 9,734,256 |
| Mode M9 | |||
|---|---|---|---|
| Quadrant | BADHDUFLAG | Total packets | Discarded packets |
| A | 0 | 230 | 0 |
| B | 0 | 229 | 0 |
| C | 0 | 229 | 0 |
| D | 0 | 229 | 0 |
| Mode SS | |||
|---|---|---|---|
| Quadrant | BADHDUFLAG | Total packets | Discarded packets |
| A | 0 | 3060 | 0 |
| B | 0 | 3052 | 0 |
| C | 0 | 3052 | 0 |
| D | 0 | 3050 | 0 |
| Mode M0 | |||
|---|---|---|---|
| Quadrant | BADHDUFLAG | Total packets | Discarded packets |
| A | 0 | 325017 | 0 |
| B | 0 | 332059 | 0 |
| C | 0 | 308578 | 0 |
| D | 0 | 623206 | 0 |
| Quadrant | Total seconds | Saturated seconds | Saturation percentage |
|---|---|---|---|
| A | 150001 | 2530 | 1.686655% |
| B | 149996 | 2224 | 1.482706% |
| C | 149980 | 1190 | 0.793439% |
| D | 149543 | 48508 | 32.437493% |
Noise dominated data is calculated using 1-second bins in cleaned event files. If a bin has >2000 counts, and if more than 50% of those come from <1% of pixels, then it is considered to be noise-dominated and hence unusable.
| Quadrant | # 1 sec bins | Bins with >0 counts | Bins with >2000 counts | High rate bins dominated by noise | Noise dominated (total time) | Noise dominated (detector-on time) | Marked lightcurve |
|---|---|---|---|---|---|---|---|
| A | 182880 | 150231 | 653 | 653 | 0.36% | 0.43% |  |
| B | 182880 | 150229 | 207 | 207 | 0.11% | 0.14% |  |
| C | 182880 | 150225 | 9 | 9 | 0.00% | 0.01% |  |
| D | 182880 | 149708 | 41005 | 41005 | 22.42% | 27.39% |  |
Top three noisy pixels from each quadrant. If the there are fewer than three noisy pixels in the level2.evt file, extra rows are filled as -1
| Pixel properties | Quadrant properties | ||||||
|---|---|---|---|---|---|---|---|
| Quadrant | DetID | PixID | Counts | Sigma | Mean | Median | Sigma |
| A | 0 | 50 | 2183602 | 582.41 | 18310 | 17954 | 3718.4 |
| A | 0 | 31 | 1782962 | 474.67 | 18310 | 17954 | 3718.4 |
| A | 8 | 15 | 1166304 | 308.83 | 18310 | 17954 | 3718.4 |
| B | 15 | 204 | 3207484 | 925.64 | 18420 | 18041 | 3445.7 |
| B | 4 | 80 | 1569370 | 450.23 | 18420 | 18041 | 3445.7 |
| B | 15 | 54 | 766520 | 217.22 | 18420 | 18041 | 3445.7 |
| C | 13 | 61 | 144993 | 31.19 | 17726 | 17889 | 4074.7 |
| C | 12 | 4 | 142028 | 30.47 | 17726 | 17889 | 4074.7 |
| C | 9 | 247 | 137906 | 29.45 | 17726 | 17889 | 4074.7 |
| D | 2 | 63 | 90611934 | 24817.03 | 14836 | 14423 | 3650.6 |
| D | 1 | 52 | 5729427 | 1565.49 | 14836 | 14423 | 3650.6 |
| D | 2 | 136 | 4293220 | 1172.07 | 14836 | 14423 | 3650.6 |
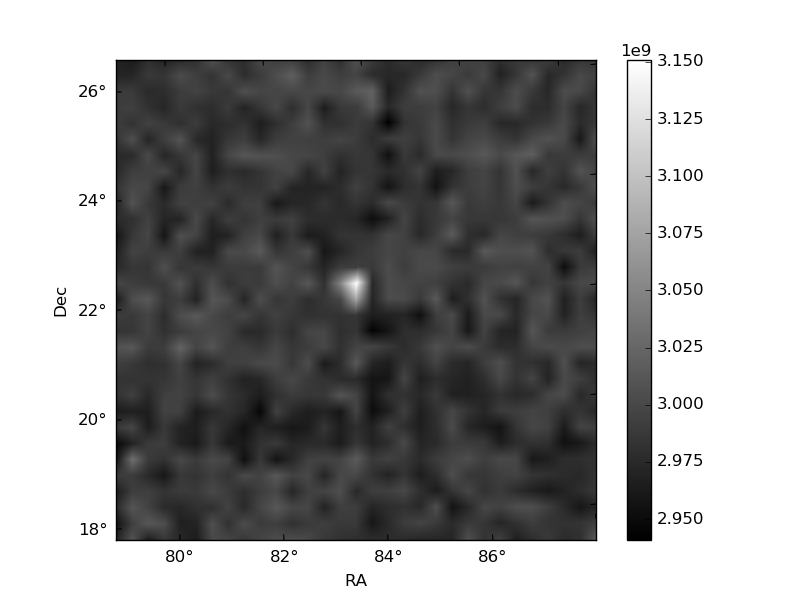
Histogram calculated using DETX and DETY for each event in the final _common_clean file
| Quadrant A |  |
 |
Quadrant B |
|---|---|---|---|
| Quadrant D |  |
 |
Quadrant C |
| Plot type | Count rate plots | Images |
|---|---|---|
| Comparison with Poisson distribution Blue bars denote a histogram of data divided into 1 sec bins. Red curve is a Poisson curve with rate = median count rate of data. |
 |
 |
| Quadrant-wise count rates Data is divided into 100 sec bins |
 |
|
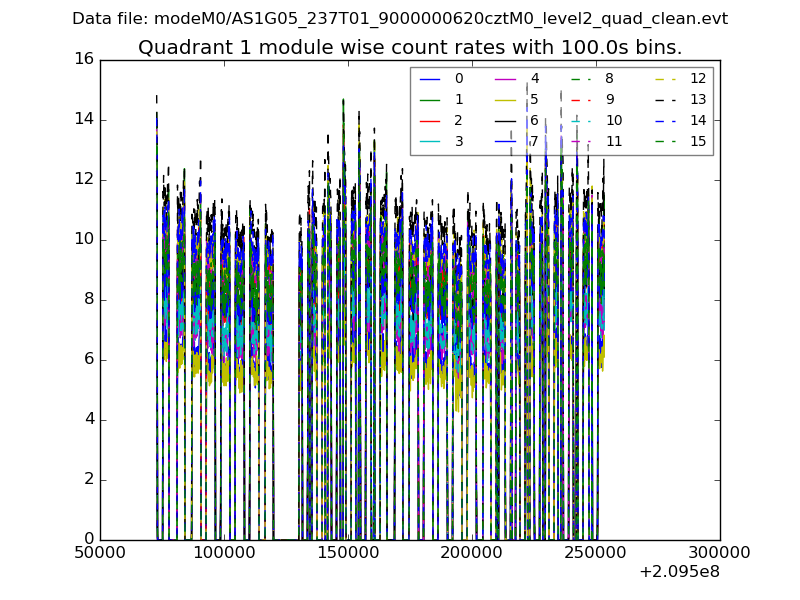
| Module-wise count rates for Quadrant A Data is divided into 100 sec bins |
 |
 |
| Module-wise count rates for Quadrant B Data is divided into 100 sec bins |
 |
 |
| Module-wise count rates for Quadrant C Data is divided into 100 sec bins |
 |
 |
| Module-wise count rates for Quadrant D Data is divided into 100 sec bins |
 |
 |
| Parameter | Plot |
|---|---|
| CZT HV Monitor | 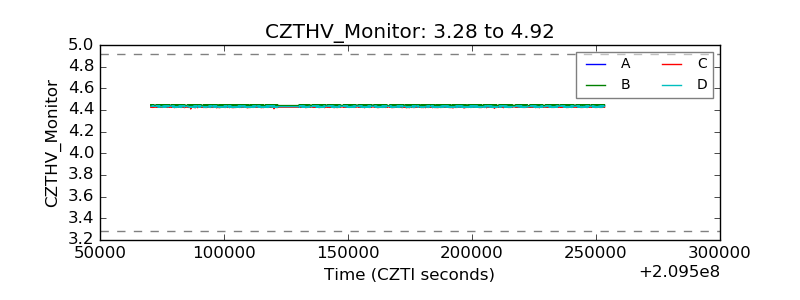 |
| D_VDD |  |
| Temperature 1 |  |
| Veto HV Monitor | 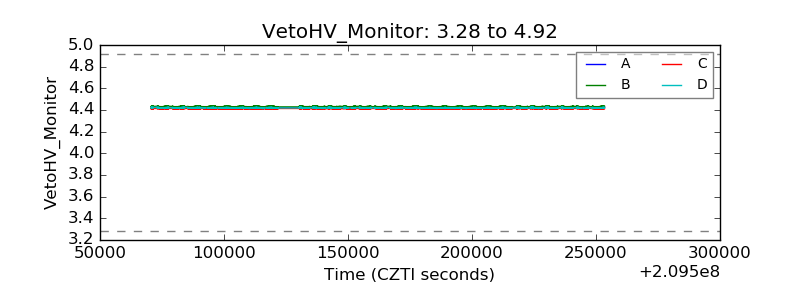 |
| Veto LLD |  |
| Alpha Counter | 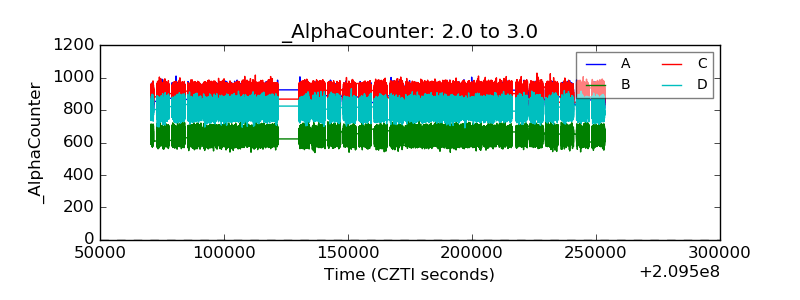 |
| _CPM_Rate |  |
| CZT Counter |  |
| +2.5 Volts monitor |  |
| +5 Volts monitor |  |
| _ROLL_ROT |  |
| _Roll_DEC | 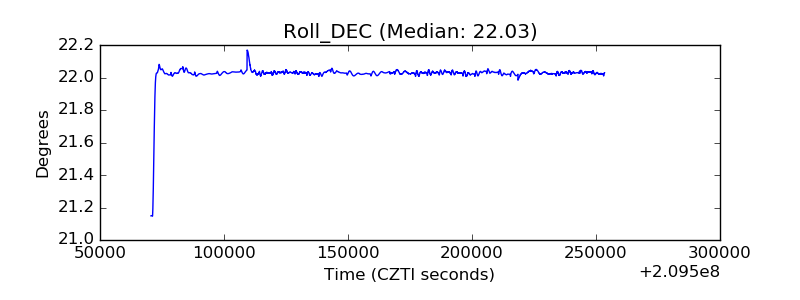 |
| _Roll_RA |  |
| Veto Counter |  |