| Param | Original file | Final file |
|---|---|---|
| Filename | modeM0/AS1G05_009T02_9000000618cztM0_level2.evt | modeM0/AS1G05_009T02_9000000618cztM0_level2_quad_clean.evt |
| Size (bytes) | 6,061,296,960 | 956,105,280 |
| Size | 5.6 GB | 911.8 MB |
| Events in quadrant A | 43,065,163 | 5,942,341 |
| Events in quadrant B | 44,584,174 | 6,000,306 |
| Events in quadrant C | 36,028,240 | 5,959,749 |
| Events in quadrant D | 54,495,803 | 5,571,367 |
| Mode SS | |||
|---|---|---|---|
| Quadrant | BADHDUFLAG | Total packets | Discarded packets |
| A | 0 | 1636 | 0 |
| B | 0 | 1640 | 0 |
| C | 0 | 1642 | 0 |
| D | 0 | 1626 | 0 |
| Mode M9 | |||
|---|---|---|---|
| Quadrant | BADHDUFLAG | Total packets | Discarded packets |
| A | 0 | 122 | 0 |
| B | 0 | 122 | 0 |
| C | 0 | 122 | 0 |
| D | 0 | 123 | 0 |
| Mode M0 | |||
|---|---|---|---|
| Quadrant | BADHDUFLAG | Total packets | Discarded packets |
| A | 0 | 183706 | 0 |
| B | 0 | 186247 | 0 |
| C | 0 | 164528 | 0 |
| D | 0 | 218351 | 0 |
| Quadrant | Total seconds | Saturated seconds | Saturation percentage |
|---|---|---|---|
| A | 79982 | 3028 | 3.785852% |
| B | 79960 | 2571 | 3.215358% |
| C | 80031 | 712 | 0.889655% |
| D | 79860 | 4996 | 6.255948% |
Noise dominated data is calculated using 1-second bins in cleaned event files. If a bin has >2000 counts, and if more than 50% of those come from <1% of pixels, then it is considered to be noise-dominated and hence unusable.
| Quadrant | # 1 sec bins | Bins with >0 counts | Bins with >2000 counts | High rate bins dominated by noise | Noise dominated (total time) | Noise dominated (detector-on time) | Marked lightcurve |
|---|---|---|---|---|---|---|---|
| A | 94915 | 80693 | 1880 | 1880 | 1.98% | 2.33% | 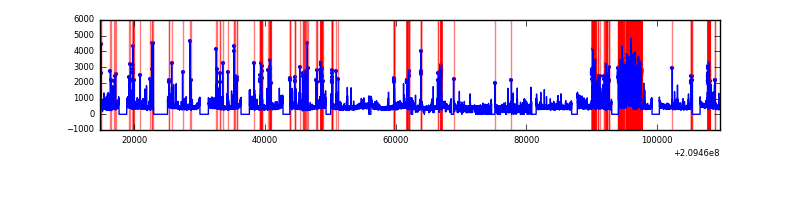 |
| B | 94915 | 80653 | 1095 | 1095 | 1.15% | 1.36% |  |
| C | 94915 | 80699 | 23 | 23 | 0.02% | 0.03% |  |
| D | 94915 | 80593 | 3584 | 3584 | 3.78% | 4.45% |  |
Top three noisy pixels from each quadrant. If the there are fewer than three noisy pixels in the level2.evt file, extra rows are filled as -1
| Pixel properties | Quadrant properties | ||||||
|---|---|---|---|---|---|---|---|
| Quadrant | DetID | PixID | Counts | Sigma | Mean | Median | Sigma |
| A | 13 | 251 | 6798515 | 3653.79 | 9208 | 9012 | 1858.2 |
| A | 0 | 50 | 411230 | 216.45 | 9208 | 9012 | 1858.2 |
| A | 8 | 15 | 289450 | 150.92 | 9208 | 9012 | 1858.2 |
| B | 10 | 16 | 5127919 | 2858.49 | 9381 | 9160 | 1790.7 |
| B | 4 | 80 | 1241029 | 687.92 | 9381 | 9160 | 1790.7 |
| B | 15 | 204 | 761842 | 420.32 | 9381 | 9160 | 1790.7 |
| C | 9 | 247 | 170188 | 77.12 | 9095 | 9135 | 2088.3 |
| C | 12 | 4 | 161203 | 72.82 | 9095 | 9135 | 2088.3 |
| C | 1 | 16 | 132297 | 58.98 | 9095 | 9135 | 2088.3 |
| D | 1 | 31 | 4523917 | 2090.0 | 8872 | 8616 | 2160.4 |
| D | 13 | 235 | 3647807 | 1684.47 | 8872 | 8616 | 2160.4 |
| D | 2 | 136 | 3417303 | 1577.78 | 8872 | 8616 | 2160.4 |
Histogram calculated using DETX and DETY for each event in the final _common_clean file
| Quadrant A |  |
 |
Quadrant B |
|---|---|---|---|
| Quadrant D |  |
 |
Quadrant C |
| Plot type | Count rate plots | Images |
|---|---|---|
| Comparison with Poisson distribution Blue bars denote a histogram of data divided into 1 sec bins. Red curve is a Poisson curve with rate = median count rate of data. |
 |
 |
| Quadrant-wise count rates Data is divided into 100 sec bins |
 |
|
| Module-wise count rates for Quadrant A Data is divided into 100 sec bins |
 |
 |
| Module-wise count rates for Quadrant B Data is divided into 100 sec bins |
 |
 |
| Module-wise count rates for Quadrant C Data is divided into 100 sec bins |
 |
 |
| Module-wise count rates for Quadrant D Data is divided into 100 sec bins |
 |
 |
| Parameter | Plot |
|---|---|
| CZT HV Monitor |  |
| D_VDD |  |
| Temperature 1 |  |
| Veto HV Monitor |  |
| Veto LLD |  |
| Alpha Counter |  |
| _CPM_Rate |  |
| CZT Counter |  |
| +2.5 Volts monitor |  |
| +5 Volts monitor |  |
| _ROLL_ROT |  |
| _Roll_DEC |  |
| _Roll_RA |  |
| Veto Counter | 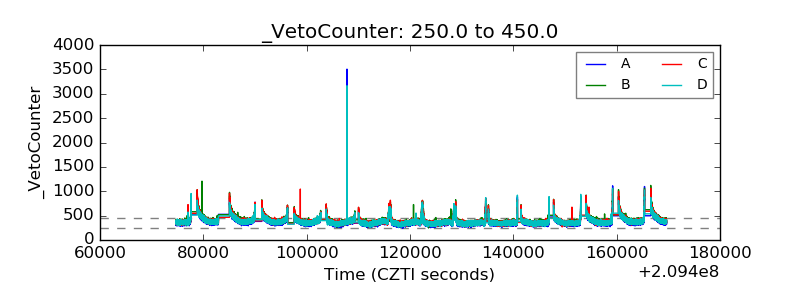 |