| Param | Original file | Final file |
|---|---|---|
| Filename | modeM0/AS1G05_002T01_9000000616cztM0_level2.evt | modeM0/AS1G05_002T01_9000000616cztM0_level2_quad_clean.evt |
| Size (bytes) | 660,991,680 | 134,400,960 |
| Size | 630.4 MB | 128.2 MB |
| Events in quadrant A | 4,565,795 | 866,024 |
| Events in quadrant B | 4,633,659 | 871,531 |
| Events in quadrant C | 4,521,575 | 861,485 |
| Events in quadrant D | 5,659,198 | 819,036 |
| Mode M0 | |||
|---|---|---|---|
| Quadrant | BADHDUFLAG | Total packets | Discarded packets |
| A | 0 | 19910 | 0 |
| B | 0 | 19964 | 0 |
| C | 0 | 19964 | 0 |
| D | 0 | 23448 | 0 |
| Mode SS | |||
|---|---|---|---|
| Quadrant | BADHDUFLAG | Total packets | Discarded packets |
| A | 0 | 194 | 0 |
| B | 0 | 194 | 0 |
| C | 0 | 194 | 0 |
| D | 0 | 194 | 0 |
| Mode M9 | |||
|---|---|---|---|
| Quadrant | BADHDUFLAG | Total packets | Discarded packets |
| A | 0 | 78 | 0 |
| B | 0 | 78 | 0 |
| C | 0 | 78 | 0 |
| D | 0 | 78 | 0 |
| Quadrant | Total seconds | Saturated seconds | Saturation percentage |
|---|---|---|---|
| A | 9403 | 148 | 1.573966% |
| B | 9401 | 110 | 1.170088% |
| C | 9400 | 105 | 1.117021% |
| D | 9405 | 316 | 3.359915% |
Noise dominated data is calculated using 1-second bins in cleaned event files. If a bin has >2000 counts, and if more than 50% of those come from <1% of pixels, then it is considered to be noise-dominated and hence unusable.
| Quadrant | # 1 sec bins | Bins with >0 counts | Bins with >2000 counts | High rate bins dominated by noise | Noise dominated (total time) | Noise dominated (detector-on time) | Marked lightcurve |
|---|---|---|---|---|---|---|---|
| A | 69082 | 9427 | 16 | 16 | 0.02% | 0.17% |  |
| B | 69082 | 9426 | 1 | 1 | 0.00% | 0.01% |  |
| C | 69082 | 9418 | 18 | 18 | 0.03% | 0.19% |  |
| D | 69082 | 9429 | 183 | 183 | 0.26% | 1.94% |  |
Top three noisy pixels from each quadrant. If the there are fewer than three noisy pixels in the level2.evt file, extra rows are filled as -1
| Pixel properties | Quadrant properties | ||||||
|---|---|---|---|---|---|---|---|
| Quadrant | DetID | PixID | Counts | Sigma | Mean | Median | Sigma |
| A | 0 | 50 | 188720 | 822.02 | 1131 | 1107 | 228.2 |
| A | 8 | 15 | 12909 | 51.71 | 1131 | 1107 | 228.2 |
| A | 12 | 194 | 11254 | 44.46 | 1131 | 1107 | 228.2 |
| B | 14 | 167 | 76748 | 352.77 | 1137 | 1110 | 214.4 |
| B | 10 | 246 | 46880 | 213.47 | 1137 | 1110 | 214.4 |
| B | 4 | 80 | 44027 | 200.16 | 1137 | 1110 | 214.4 |
| C | 9 | 247 | 235684 | 936.47 | 1092 | 1098 | 250.5 |
| C | 12 | 4 | 12265 | 44.58 | 1092 | 1098 | 250.5 |
| C | 13 | 61 | 9088 | 31.9 | 1092 | 1098 | 250.5 |
| D | 1 | 31 | 536975 | 2034.47 | 1083 | 1048 | 263.4 |
| D | 13 | 235 | 378528 | 1432.98 | 1083 | 1048 | 263.4 |
| D | 2 | 136 | 281066 | 1063.0 | 1083 | 1048 | 263.4 |
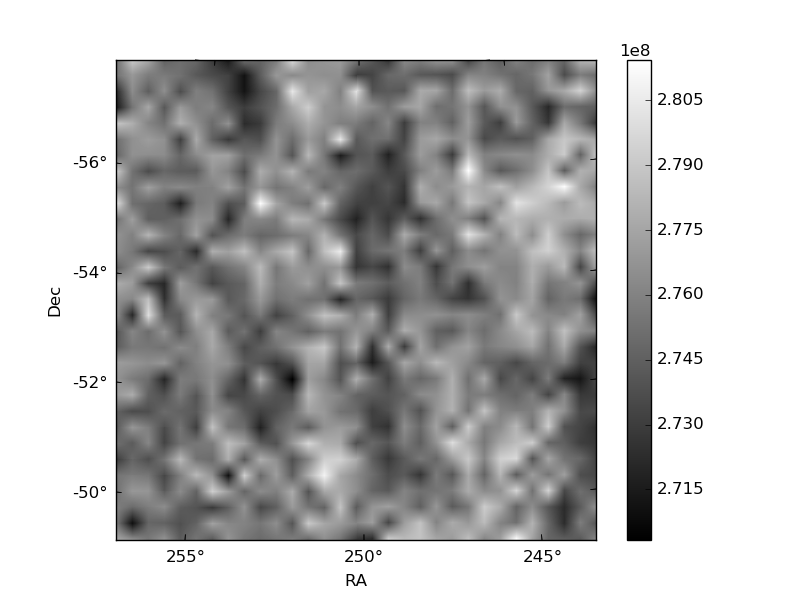
Histogram calculated using DETX and DETY for each event in the final _common_clean file
| Quadrant A |  |
 |
Quadrant B |
|---|---|---|---|
| Quadrant D |  |
 |
Quadrant C |
| Plot type | Count rate plots | Images |
|---|---|---|
| Comparison with Poisson distribution Blue bars denote a histogram of data divided into 1 sec bins. Red curve is a Poisson curve with rate = median count rate of data. |
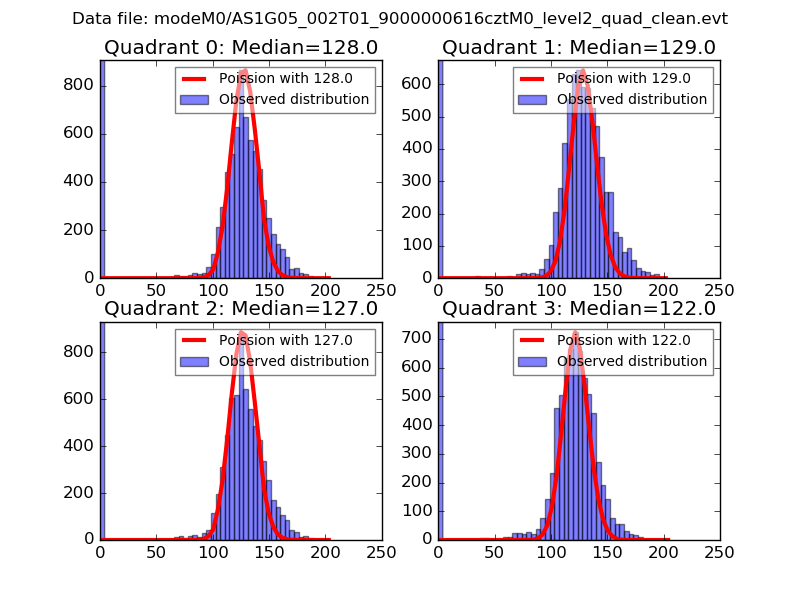 |
 |
| Quadrant-wise count rates Data is divided into 100 sec bins |
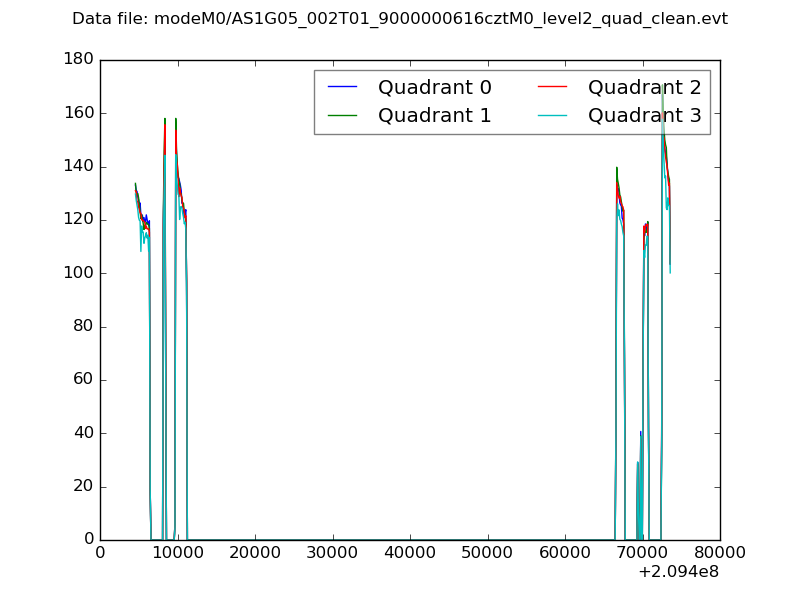 |
|
| Module-wise count rates for Quadrant A Data is divided into 100 sec bins |
 |
 |
| Module-wise count rates for Quadrant B Data is divided into 100 sec bins |
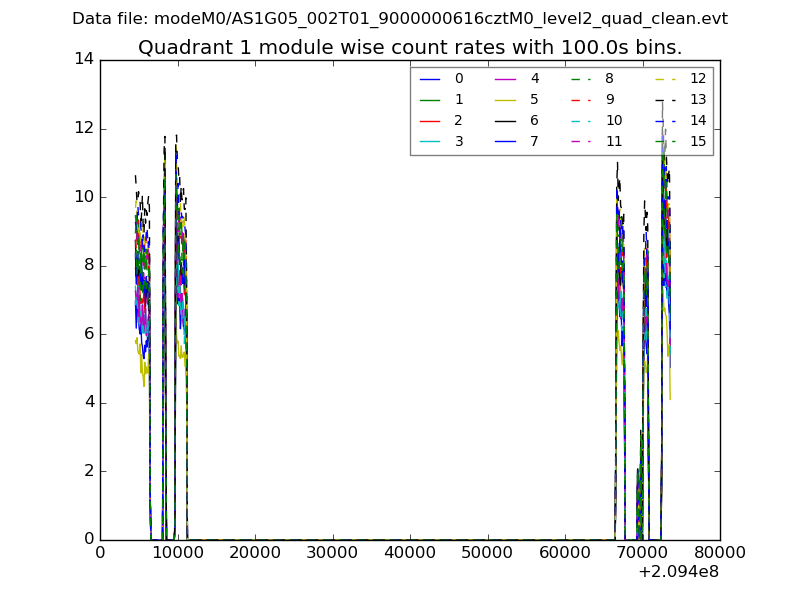 |
 |
| Module-wise count rates for Quadrant C Data is divided into 100 sec bins |
 |
 |
| Module-wise count rates for Quadrant D Data is divided into 100 sec bins |
 |
 |
| Parameter | Plot |
|---|---|
| CZT HV Monitor |  |
| D_VDD |  |
| Temperature 1 |  |
| Veto HV Monitor |  |
| Veto LLD |  |
| Alpha Counter | 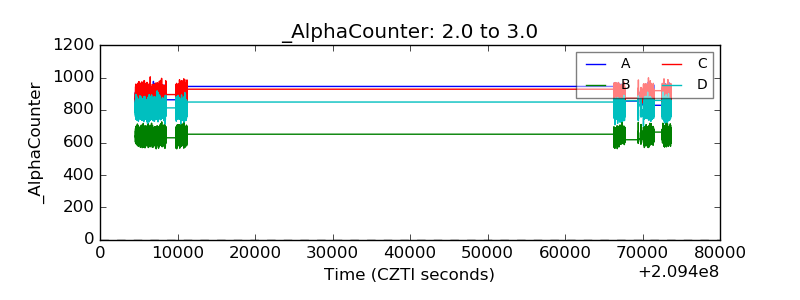 |
| _CPM_Rate |  |
| CZT Counter |  |
| +2.5 Volts monitor | 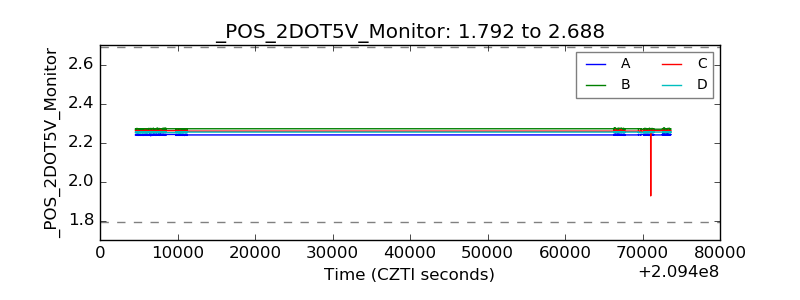 |
| +5 Volts monitor |  |
| _ROLL_ROT |  |
| _Roll_DEC |  |
| _Roll_RA | 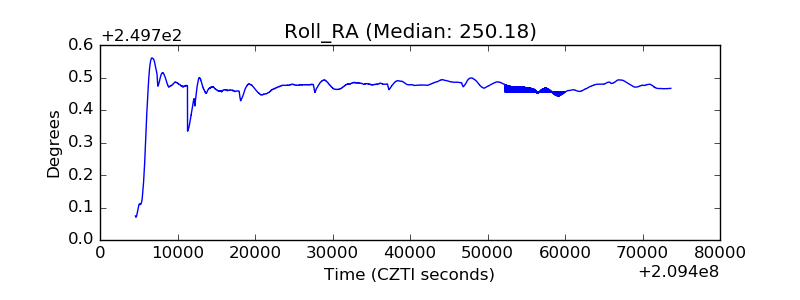 |
| Veto Counter |  |