| Param | Original file | Final file |
|---|---|---|
| Filename | modeM0/AS1G05_253T02_9000000614cztM0_level2_bc.evt | modeM0/AS1G05_253T02_9000000614cztM0_level2_quad_clean.evt |
| Size (bytes) | 3,707,170,560 | 1,357,332,480 |
| Size | 3.5 GB | 1.3 GB |
| Events in quadrant A | 22,330,886 | 8,578,467 |
| Events in quadrant B | 28,710,052 | 8,582,828 |
| Events in quadrant C | 23,140,763 | 8,606,239 |
| Events in quadrant D | 30,933,005 | 8,146,000 |
| Mode M9 | |||
|---|---|---|---|
| Quadrant | BADHDUFLAG | Total packets | Discarded packets |
| A | 0 | 175 | 0 |
| B | 0 | 175 | 0 |
| C | 0 | 175 | 0 |
| D | 0 | 174 | 0 |
| Mode SS | |||
|---|---|---|---|
| Quadrant | BADHDUFLAG | Total packets | Discarded packets |
| A | 0 | 2146 | 0 |
| B | 0 | 2140 | 0 |
| C | 0 | 2152 | 0 |
| D | 0 | 2148 | 0 |
| Mode M0 | |||
|---|---|---|---|
| Quadrant | BADHDUFLAG | Total packets | Discarded packets |
| A | 0 | 224163 | 0 |
| B | 0 | 241610 | 0 |
| C | 0 | 225087 | 0 |
| D | 0 | 255783 | 0 |
| Quadrant | Total seconds | Saturated seconds | Saturation percentage |
|---|---|---|---|
| A | 105044 | 1946 | 1.852557% |
| B | 105034 | 2271 | 2.162157% |
| C | 105046 | 1234 | 1.174723% |
| D | 105006 | 3468 | 3.302668% |
Noise dominated data is calculated using 1-second bins in cleaned event files. If a bin has >2000 counts, and if more than 50% of those come from <1% of pixels, then it is considered to be noise-dominated and hence unusable.
| Quadrant | # 1 sec bins | Bins with >0 counts | Bins with >2000 counts | High rate bins dominated by noise | Noise dominated (total time) | Noise dominated (detector-on time) | Marked lightcurve |
|---|---|---|---|---|---|---|---|
| A | 123154 | 105275 | 104 | 104 | 0.08% | 0.10% |  |
| B | 123154 | 105277 | 291 | 291 | 0.24% | 0.28% |  |
| C | 123154 | 105267 | 42 | 42 | 0.03% | 0.04% |  |
| D | 123154 | 105258 | 225 | 225 | 0.18% | 0.21% | 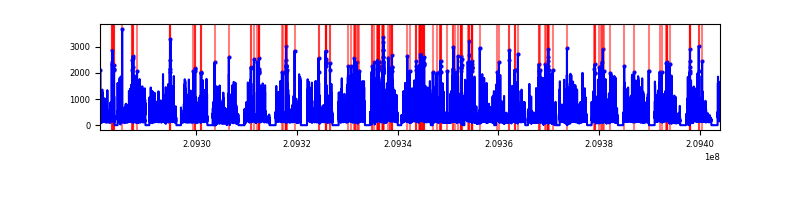 |
Top three noisy pixels from each quadrant. If the there are fewer than three noisy pixels in the level2.evt file, extra rows are filled as -1
| Pixel properties | Quadrant properties | ||||||
|---|---|---|---|---|---|---|---|
| Quadrant | DetID | PixID | Counts | Sigma | Mean | Median | Sigma |
| A | 13 | 251 | 1003778 | 874.5 | 5114 | 4994 | 1142.1 |
| A | 0 | 50 | 651147 | 565.75 | 5114 | 4994 | 1142.1 |
| A | 8 | 15 | 394122 | 340.71 | 5114 | 4994 | 1142.1 |
| B | 14 | 167 | 3819671 | 3837.65 | 5149 | 4999 | 994.0 |
| B | 10 | 16 | 1617925 | 1622.64 | 5149 | 4999 | 994.0 |
| B | 8 | 3 | 958142 | 958.88 | 5149 | 4999 | 994.0 |
| C | 8 | 208 | 1978105 | 1753.4 | 5035 | 4945 | 1125.3 |
| C | 9 | 247 | 949011 | 838.92 | 5035 | 4945 | 1125.3 |
| C | 12 | 4 | 246494 | 214.65 | 5035 | 4945 | 1125.3 |
| D | 2 | 234 | 2776051 | 2335.82 | 5020 | 4812 | 1186.4 |
| D | 13 | 235 | 2670511 | 2246.86 | 5020 | 4812 | 1186.4 |
| D | 2 | 136 | 2138016 | 1798.04 | 5020 | 4812 | 1186.4 |
Histogram calculated using DETX and DETY for each event in the final _common_clean file
| Quadrant A |  |
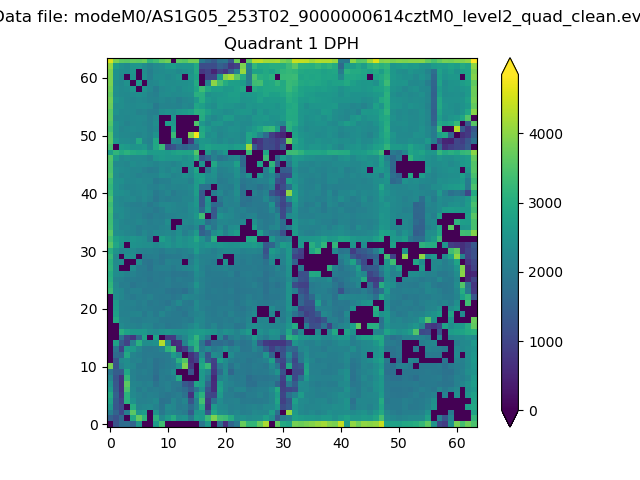 |
Quadrant B |
|---|---|---|---|
| Quadrant D |  |
 |
Quadrant C |
| Plot type | Count rate plots | Images |
|---|---|---|
| Comparison with Poisson distribution Blue bars denote a histogram of data divided into 1 sec bins. Red curve is a Poisson curve with rate = median count rate of data. |
 |
 |
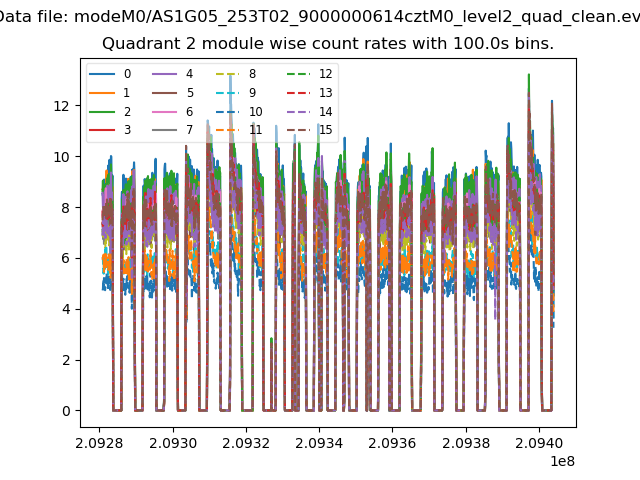
| Quadrant-wise count rates Data is divided into 100 sec bins |
 |
|
| Module-wise count rates for Quadrant A Data is divided into 100 sec bins |
 |
 |
| Module-wise count rates for Quadrant B Data is divided into 100 sec bins |
 |
 |
| Module-wise count rates for Quadrant C Data is divided into 100 sec bins |
 |
 |
| Module-wise count rates for Quadrant D Data is divided into 100 sec bins |
 |
 |
| Parameter | Plot |
|---|---|
| CZT HV Monitor |  |
| D_VDD |  |
| Temperature 1 |  |
| Veto HV Monitor | 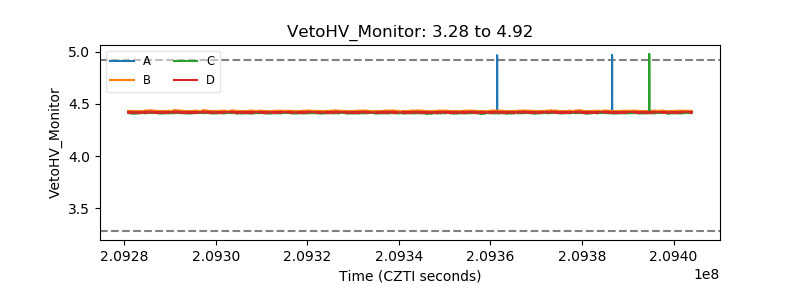 |
| Veto LLD |  |
| Alpha Counter | 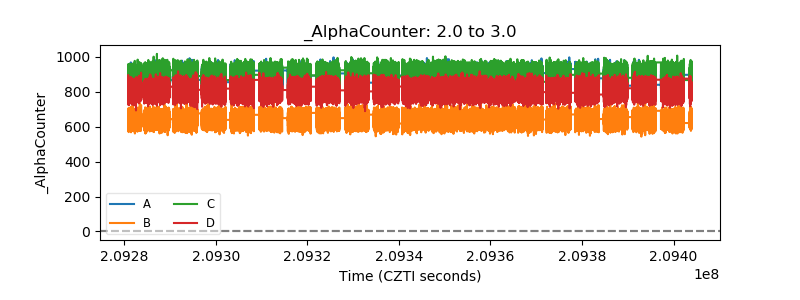 |
| _CPM_Rate |  |
| CZT Counter |  |
| +2.5 Volts monitor |  |
| +5 Volts monitor |  |
| _ROLL_ROT | 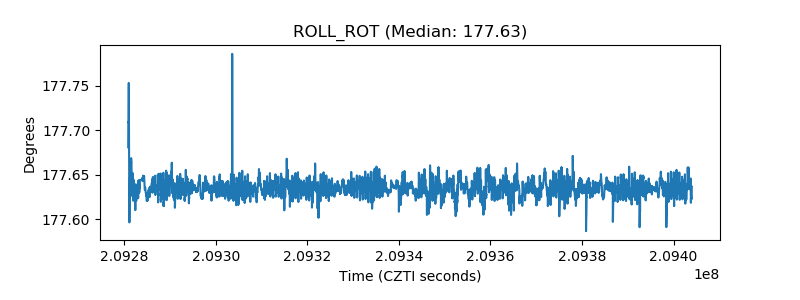 |
| _Roll_DEC |  |
| _Roll_RA | 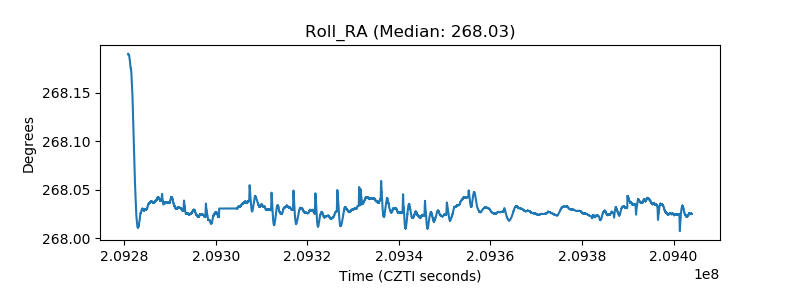 |
| Veto Counter | 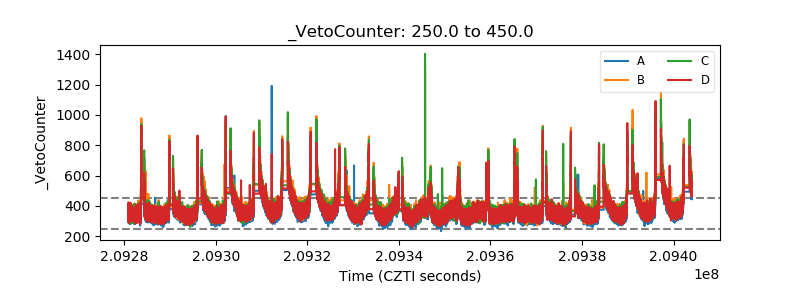 |