| Param | Original file | Final file |
|---|---|---|
| Filename | modeM0/AS1G05_142T01_9000000610cztM0_level2.evt | modeM0/AS1G05_142T01_9000000610cztM0_level2_quad_clean.evt |
| Size (bytes) | 3,443,526,720 | 545,388,480 |
| Size | 3.2 GB | 520.1 MB |
| Events in quadrant A | 22,497,738 | 3,380,030 |
| Events in quadrant B | 24,173,515 | 3,435,315 |
| Events in quadrant C | 21,397,506 | 3,455,831 |
| Events in quadrant D | 33,239,188 | 3,214,834 |
| Mode M9 | |||
|---|---|---|---|
| Quadrant | BADHDUFLAG | Total packets | Discarded packets |
| A | 0 | 64 | 0 |
| B | 0 | 64 | 0 |
| C | 0 | 64 | 0 |
| D | 0 | 64 | 0 |
| Mode SS | |||
|---|---|---|---|
| Quadrant | BADHDUFLAG | Total packets | Discarded packets |
| A | 0 | 900 | 0 |
| B | 0 | 908 | 0 |
| C | 0 | 900 | 0 |
| D | 0 | 898 | 0 |
| Mode M0 | |||
|---|---|---|---|
| Quadrant | BADHDUFLAG | Total packets | Discarded packets |
| A | 0 | 97052 | 0 |
| B | 0 | 101092 | 0 |
| C | 0 | 94801 | 0 |
| D | 0 | 129745 | 0 |
| Quadrant | Total seconds | Saturated seconds | Saturation percentage |
|---|---|---|---|
| A | 44220 | 1285 | 2.905925% |
| B | 44250 | 1229 | 2.777401% |
| C | 44218 | 690 | 1.560450% |
| D | 44045 | 4238 | 9.621978% |
Noise dominated data is calculated using 1-second bins in cleaned event files. If a bin has >2000 counts, and if more than 50% of those come from <1% of pixels, then it is considered to be noise-dominated and hence unusable.
| Quadrant | # 1 sec bins | Bins with >0 counts | Bins with >2000 counts | High rate bins dominated by noise | Noise dominated (total time) | Noise dominated (detector-on time) | Marked lightcurve |
|---|---|---|---|---|---|---|---|
| A | 49946 | 44422 | 463 | 463 | 0.93% | 1.04% |  |
| B | 49945 | 44447 | 465 | 465 | 0.93% | 1.05% |  |
| C | 49946 | 44436 | 206 | 206 | 0.41% | 0.46% | 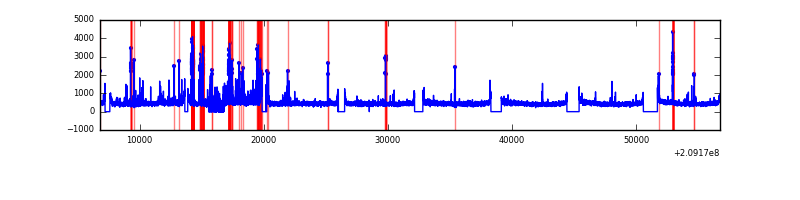 |
| D | 49945 | 44199 | 3555 | 3555 | 7.12% | 8.04% |  |
Top three noisy pixels from each quadrant. If the there are fewer than three noisy pixels in the level2.evt file, extra rows are filled as -1
| Pixel properties | Quadrant properties | ||||||
|---|---|---|---|---|---|---|---|
| Quadrant | DetID | PixID | Counts | Sigma | Mean | Median | Sigma |
| A | 13 | 251 | 1788712 | 1693.93 | 5151 | 5033 | 1053.0 |
| A | 8 | 15 | 377084 | 353.33 | 5151 | 5033 | 1053.0 |
| A | 0 | 50 | 249214 | 231.9 | 5151 | 5033 | 1053.0 |
| B | 10 | 16 | 2870441 | 2852.69 | 5223 | 5107 | 1004.4 |
| B | 4 | 80 | 576315 | 568.69 | 5223 | 5107 | 1004.4 |
| B | 15 | 54 | 163912 | 158.1 | 5223 | 5107 | 1004.4 |
| C | 9 | 247 | 1486011 | 1274.06 | 5023 | 5052 | 1162.4 |
| C | 12 | 4 | 87840 | 71.22 | 5023 | 5052 | 1162.4 |
| C | 9 | 54 | 74030 | 59.34 | 5023 | 5052 | 1162.4 |
| D | 12 | 79 | 7763706 | 6716.89 | 4781 | 4643 | 1155.2 |
| D | 13 | 235 | 4521522 | 3910.19 | 4781 | 4643 | 1155.2 |
| D | 2 | 136 | 1184857 | 1021.69 | 4781 | 4643 | 1155.2 |
Histogram calculated using DETX and DETY for each event in the final _common_clean file
| Quadrant A |  |
 |
Quadrant B |
|---|---|---|---|
| Quadrant D | 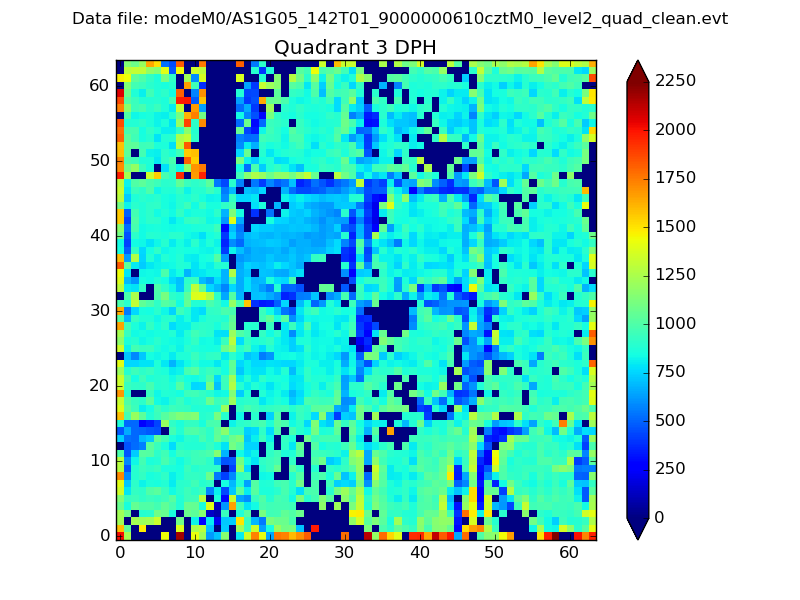 |
 |
Quadrant C |
| Plot type | Count rate plots | Images |
|---|---|---|
| Comparison with Poisson distribution Blue bars denote a histogram of data divided into 1 sec bins. Red curve is a Poisson curve with rate = median count rate of data. |
 |
 |
| Quadrant-wise count rates Data is divided into 100 sec bins |
 |
|
| Module-wise count rates for Quadrant A Data is divided into 100 sec bins |
 |
 |
| Module-wise count rates for Quadrant B Data is divided into 100 sec bins |
 |
 |
| Module-wise count rates for Quadrant C Data is divided into 100 sec bins |
 |
 |
| Module-wise count rates for Quadrant D Data is divided into 100 sec bins |
 |
 |
| Parameter | Plot |
|---|---|
| CZT HV Monitor |  |
| D_VDD |  |
| Temperature 1 |  |
| Veto HV Monitor |  |
| Veto LLD |  |
| Alpha Counter |  |
| _CPM_Rate |  |
| CZT Counter | 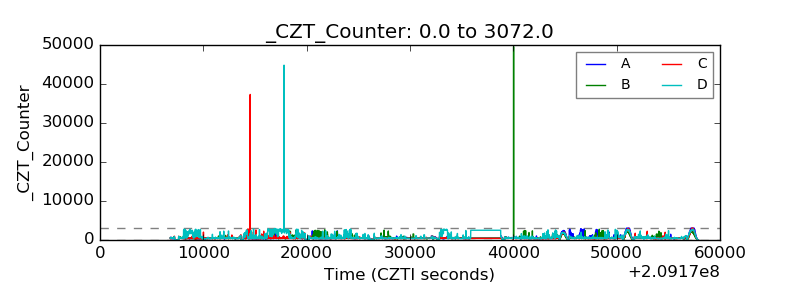 |
| +2.5 Volts monitor |  |
| +5 Volts monitor |  |
| _ROLL_ROT |  |
| _Roll_DEC |  |
| _Roll_RA |  |
| Veto Counter |  |