| Param | Original file | Final file |
|---|---|---|
| Filename | modeM0/AS1G05_245T01_9000000606cztM0_level2_bc.evt | modeM0/AS1G05_245T01_9000000606cztM0_level2_quad_clean.evt |
| Size (bytes) | 369,812,160 | 123,612,480 |
| Size | 352.7 MB | 117.9 MB |
| Events in quadrant A | 2,231,766 | 767,222 |
| Events in quadrant B | 2,920,880 | 762,575 |
| Events in quadrant C | 2,266,458 | 760,597 |
| Events in quadrant D | 3,039,522 | 707,675 |
| Mode SS | |||
|---|---|---|---|
| Quadrant | BADHDUFLAG | Total packets | Discarded packets |
| A | 0 | 218 | 0 |
| B | 0 | 218 | 0 |
| C | 0 | 218 | 0 |
| D | 0 | 218 | 0 |
| Mode M9 | |||
|---|---|---|---|
| Quadrant | BADHDUFLAG | Total packets | Discarded packets |
| A | 0 | 14 | 0 |
| B | 0 | 14 | 0 |
| C | 0 | 14 | 0 |
| D | 0 | 14 | 0 |
| Mode M0 | |||
|---|---|---|---|
| Quadrant | BADHDUFLAG | Total packets | Discarded packets |
| A | 0 | 22333 | 0 |
| B | 0 | 24568 | 0 |
| C | 0 | 22456 | 0 |
| D | 0 | 25828 | 0 |
| Quadrant | Total seconds | Saturated seconds | Saturation percentage |
|---|---|---|---|
| A | 10769 | 193 | 1.792181% |
| B | 10769 | 264 | 2.451481% |
| C | 10767 | 116 | 1.077366% |
| D | 10768 | 465 | 4.318351% |
Noise dominated data is calculated using 1-second bins in cleaned event files. If a bin has >2000 counts, and if more than 50% of those come from <1% of pixels, then it is considered to be noise-dominated and hence unusable.
| Quadrant | # 1 sec bins | Bins with >0 counts | Bins with >2000 counts | High rate bins dominated by noise | Noise dominated (total time) | Noise dominated (detector-on time) | Marked lightcurve |
|---|---|---|---|---|---|---|---|
| A | 12140 | 10771 | 3 | 3 | 0.02% | 0.03% |  |
| B | 12140 | 10768 | 11 | 11 | 0.09% | 0.10% |  |
| C | 12140 | 10770 | 3 | 3 | 0.02% | 0.03% |  |
| D | 12140 | 10760 | 27 | 27 | 0.22% | 0.25% | 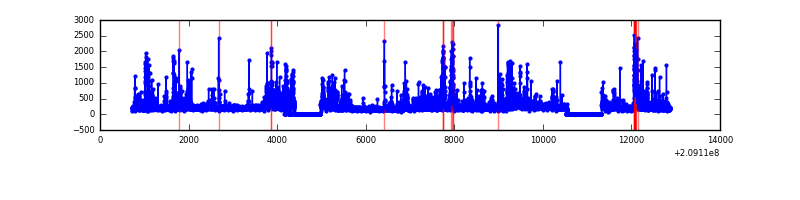 |
Top three noisy pixels from each quadrant. If the there are fewer than three noisy pixels in the level2.evt file, extra rows are filled as -1
| Pixel properties | Quadrant properties | ||||||
|---|---|---|---|---|---|---|---|
| Quadrant | DetID | PixID | Counts | Sigma | Mean | Median | Sigma |
| A | 14 | 238 | 55338 | 435.41 | 542 | 530 | 125.9 |
| A | 13 | 251 | 33442 | 261.46 | 542 | 530 | 125.9 |
| A | 13 | 6 | 20994 | 162.57 | 542 | 530 | 125.9 |
| B | 15 | 204 | 314834 | 2911.36 | 545 | 533 | 108.0 |
| B | 14 | 167 | 194196 | 1793.89 | 545 | 533 | 108.0 |
| B | 10 | 16 | 183027 | 1690.43 | 545 | 533 | 108.0 |
| C | 12 | 4 | 165990 | 1336.73 | 534 | 527 | 123.8 |
| C | 1 | 16 | 10221 | 78.32 | 534 | 527 | 123.8 |
| C | 13 | 61 | 3621 | 25.0 | 534 | 527 | 123.8 |
| D | 13 | 235 | 348399 | 2769.73 | 521 | 501 | 125.6 |
| D | 2 | 136 | 184127 | 1461.91 | 521 | 501 | 125.6 |
| D | 13 | 239 | 177194 | 1406.71 | 521 | 501 | 125.6 |
Histogram calculated using DETX and DETY for each event in the final _common_clean file
| Quadrant A |  |
 |
Quadrant B |
|---|---|---|---|
| Quadrant D |  |
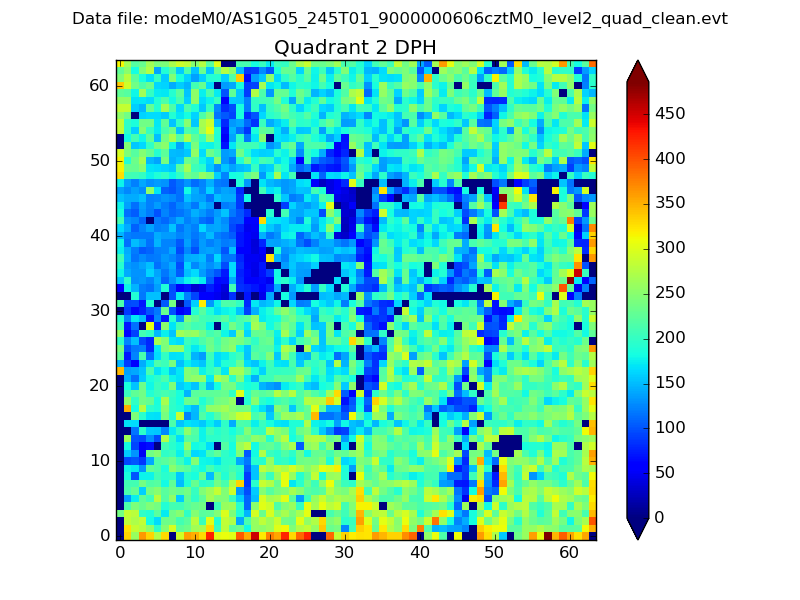 |
Quadrant C |
| Plot type | Count rate plots | Images |
|---|---|---|
| Comparison with Poisson distribution Blue bars denote a histogram of data divided into 1 sec bins. Red curve is a Poisson curve with rate = median count rate of data. |
 |
 |
| Quadrant-wise count rates Data is divided into 100 sec bins |
 |
|
| Module-wise count rates for Quadrant A Data is divided into 100 sec bins |
 |
 |
| Module-wise count rates for Quadrant B Data is divided into 100 sec bins |
 |
 |
| Module-wise count rates for Quadrant C Data is divided into 100 sec bins |
 |
 |
| Module-wise count rates for Quadrant D Data is divided into 100 sec bins |
 |
 |
| Parameter | Plot |
|---|---|
| CZT HV Monitor |  |
| D_VDD |  |
| Temperature 1 |  |
| Veto HV Monitor | 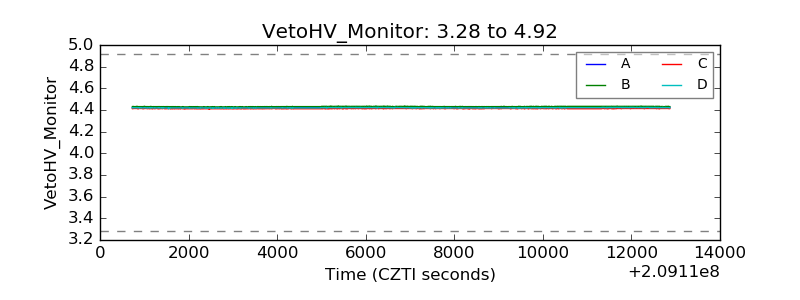 |
| Veto LLD | 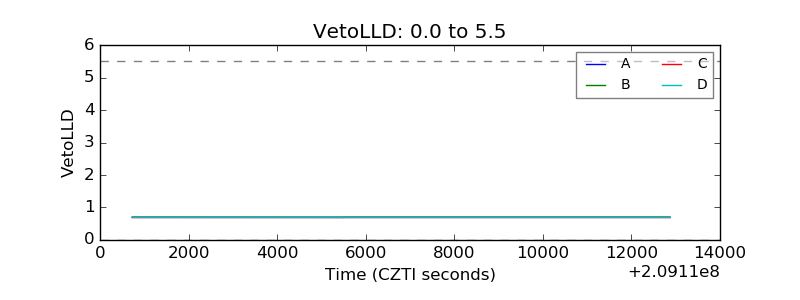 |
| Alpha Counter |  |
| _CPM_Rate |  |
| CZT Counter |  |
| +2.5 Volts monitor |  |
| +5 Volts monitor | 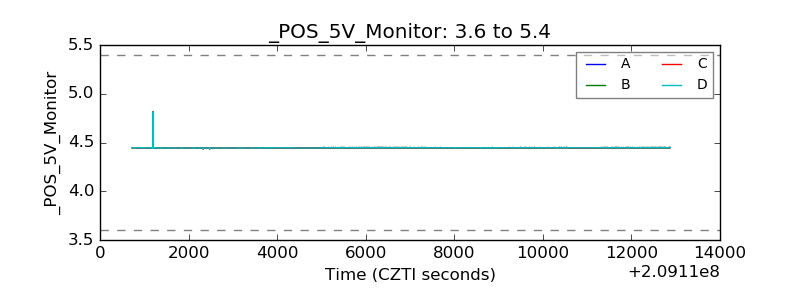 |
| _ROLL_ROT | 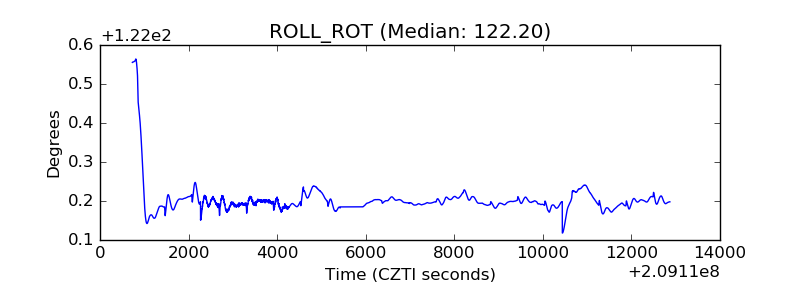 |
| _Roll_DEC |  |
| _Roll_RA |  |
| Veto Counter | 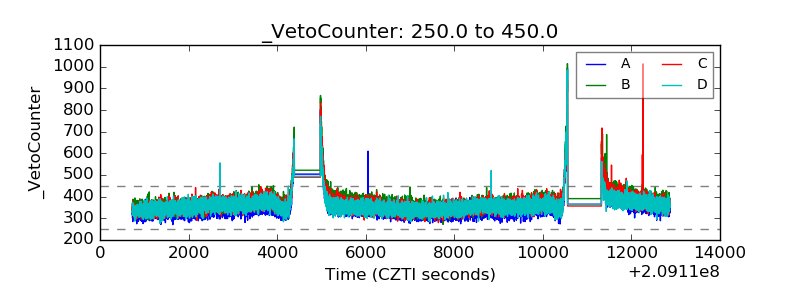 |