| Param | Original file | Final file |
|---|---|---|
| Filename | modeM0/AS1G05_002T03_9000000608cztM0_level2.evt | modeM0/AS1G05_002T03_9000000608cztM0_level2_quad_clean.evt |
| Size (bytes) | 2,900,131,200 | 463,821,120 |
| Size | 2.7 GB | 442.3 MB |
| Events in quadrant A | 18,468,591 | 2,907,718 |
| Events in quadrant B | 18,464,271 | 2,967,560 |
| Events in quadrant C | 18,042,777 | 2,943,201 |
| Events in quadrant D | 30,378,930 | 2,707,921 |
| Mode SS | |||
|---|---|---|---|
| Quadrant | BADHDUFLAG | Total packets | Discarded packets |
| A | 0 | 746 | 0 |
| B | 0 | 746 | 0 |
| C | 0 | 746 | 0 |
| D | 0 | 746 | 0 |
| Mode M0 | |||
|---|---|---|---|
| Quadrant | BADHDUFLAG | Total packets | Discarded packets |
| A | 0 | 79929 | 0 |
| B | 0 | 79471 | 0 |
| C | 0 | 79656 | 0 |
| D | 0 | 115697 | 0 |
| Mode M9 | |||
|---|---|---|---|
| Quadrant | BADHDUFLAG | Total packets | Discarded packets |
| A | 0 | 67 | 0 |
| B | 0 | 67 | 0 |
| C | 0 | 67 | 0 |
| D | 0 | 67 | 0 |
| Quadrant | Total seconds | Saturated seconds | Saturation percentage |
|---|---|---|---|
| A | 36713 | 689 | 1.876719% |
| B | 36713 | 381 | 1.037780% |
| C | 36712 | 524 | 1.427326% |
| D | 36714 | 4865 | 13.251076% |
Noise dominated data is calculated using 1-second bins in cleaned event files. If a bin has >2000 counts, and if more than 50% of those come from <1% of pixels, then it is considered to be noise-dominated and hence unusable.
| Quadrant | # 1 sec bins | Bins with >0 counts | Bins with >2000 counts | High rate bins dominated by noise | Noise dominated (total time) | Noise dominated (detector-on time) | Marked lightcurve |
|---|---|---|---|---|---|---|---|
| A | 48306 | 36717 | 227 | 227 | 0.47% | 0.62% |  |
| B | 48306 | 36717 | 45 | 45 | 0.09% | 0.12% |  |
| C | 48306 | 36719 | 267 | 267 | 0.55% | 0.73% | 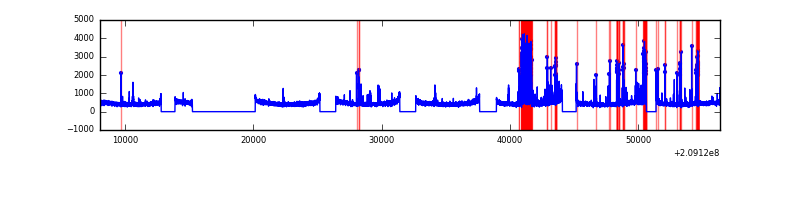 |
| D | 48306 | 36719 | 4496 | 4496 | 9.31% | 12.24% |  |
Top three noisy pixels from each quadrant. If the there are fewer than three noisy pixels in the level2.evt file, extra rows are filled as -1
| Pixel properties | Quadrant properties | ||||||
|---|---|---|---|---|---|---|---|
| Quadrant | DetID | PixID | Counts | Sigma | Mean | Median | Sigma |
| A | 0 | 50 | 964856 | 1089.5 | 4330 | 4242 | 881.7 |
| A | 13 | 251 | 571199 | 643.03 | 4330 | 4242 | 881.7 |
| A | 8 | 15 | 126586 | 138.76 | 4330 | 4242 | 881.7 |
| B | 15 | 204 | 556027 | 662.61 | 4388 | 4288 | 832.7 |
| B | 10 | 16 | 281367 | 332.76 | 4388 | 4288 | 832.7 |
| B | 14 | 167 | 225717 | 265.92 | 4388 | 4288 | 832.7 |
| C | 9 | 247 | 1534338 | 1584.06 | 4185 | 4196 | 966.0 |
| C | 12 | 4 | 152637 | 153.67 | 4185 | 4196 | 966.0 |
| C | 13 | 61 | 34701 | 31.58 | 4185 | 4196 | 966.0 |
| D | 13 | 235 | 11974803 | 12475.93 | 4000 | 3892 | 959.5 |
| D | 2 | 136 | 920293 | 955.06 | 4000 | 3892 | 959.5 |
| D | 2 | 234 | 591992 | 612.91 | 4000 | 3892 | 959.5 |
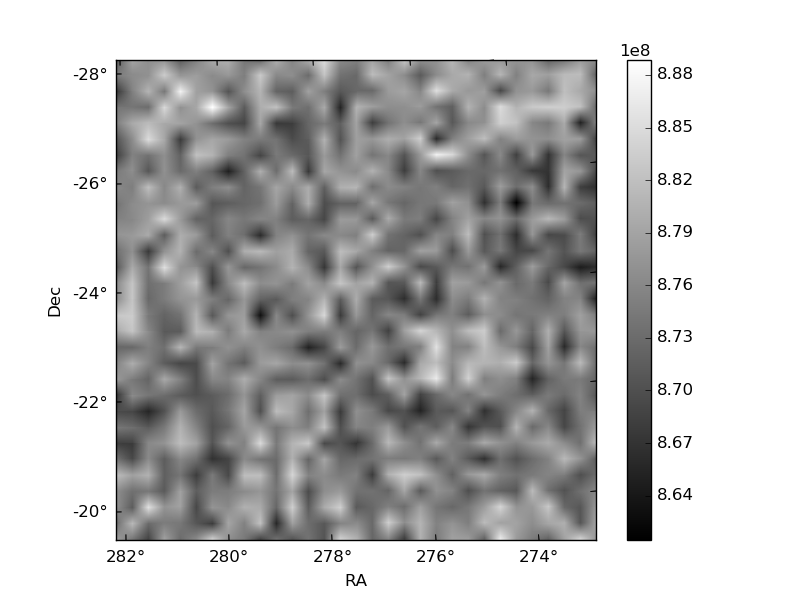
Histogram calculated using DETX and DETY for each event in the final _common_clean file
| Quadrant A |  |
 |
Quadrant B |
|---|---|---|---|
| Quadrant D |  |
 |
Quadrant C |
| Plot type | Count rate plots | Images |
|---|---|---|
| Comparison with Poisson distribution Blue bars denote a histogram of data divided into 1 sec bins. Red curve is a Poisson curve with rate = median count rate of data. |
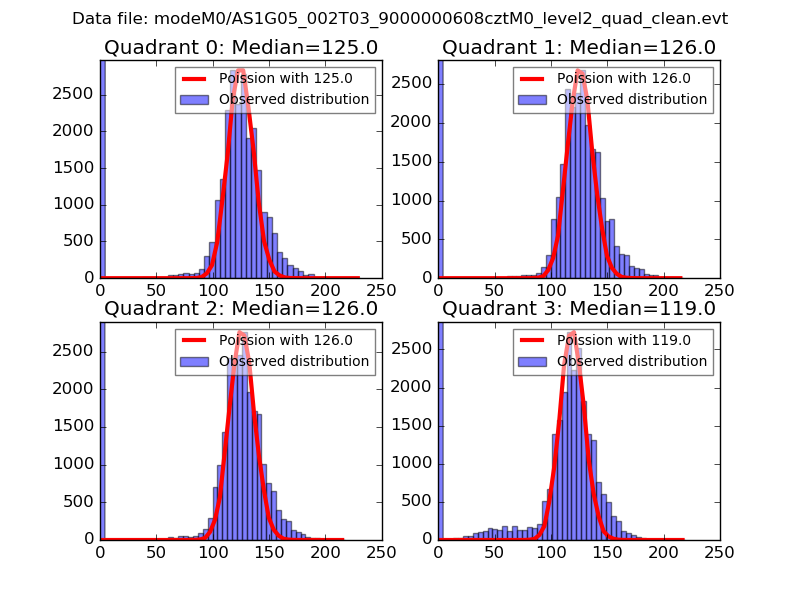 |
 |
| Quadrant-wise count rates Data is divided into 100 sec bins |
 |
|
| Module-wise count rates for Quadrant A Data is divided into 100 sec bins |
 |
 |
| Module-wise count rates for Quadrant B Data is divided into 100 sec bins |
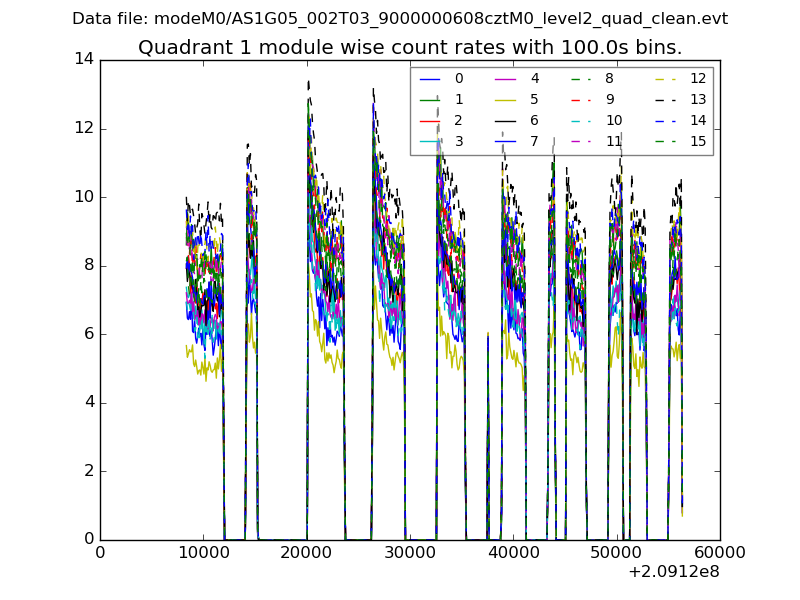 |
 |
| Module-wise count rates for Quadrant C Data is divided into 100 sec bins |
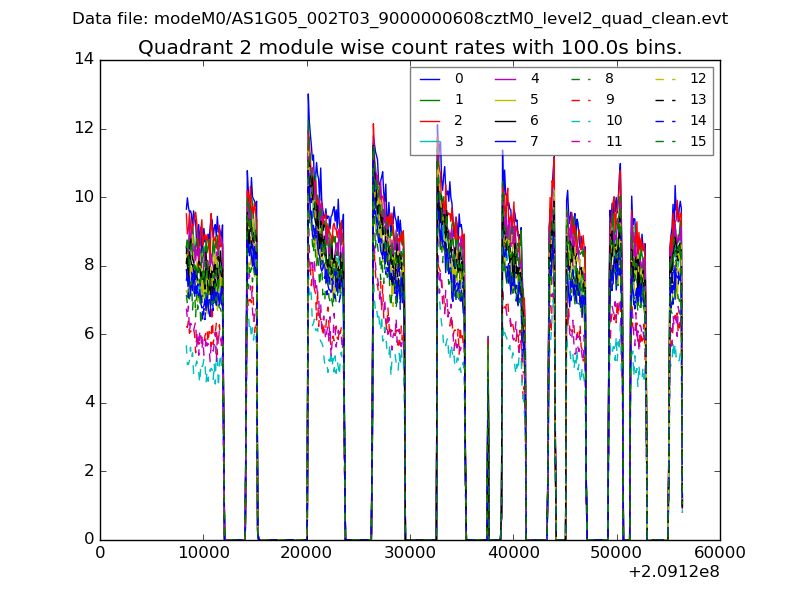 |
 |
| Module-wise count rates for Quadrant D Data is divided into 100 sec bins |
 |
 |
| Parameter | Plot |
|---|---|
| CZT HV Monitor | 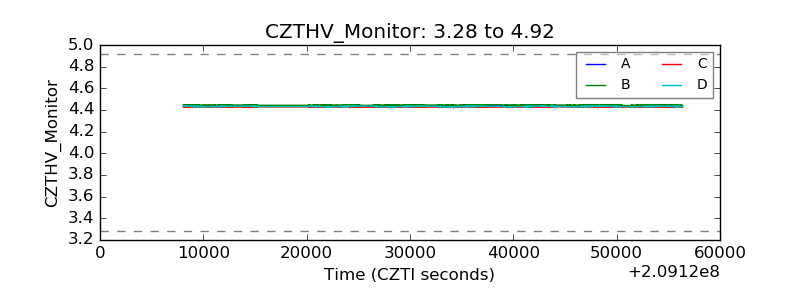 |
| D_VDD |  |
| Temperature 1 |  |
| Veto HV Monitor | 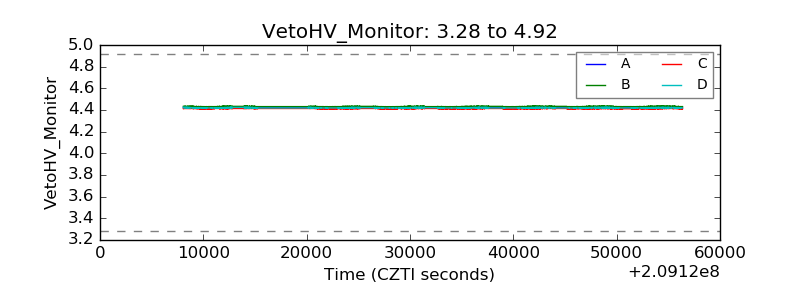 |
| Veto LLD | 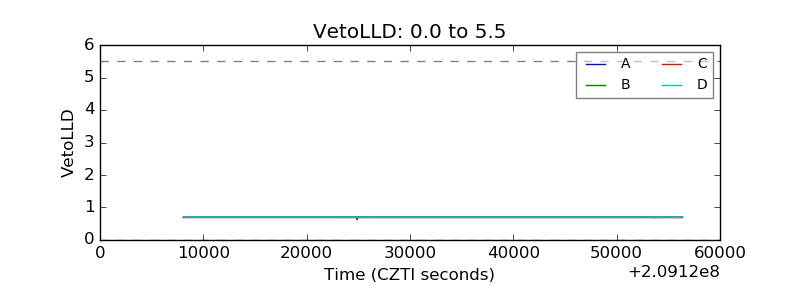 |
| Alpha Counter |  |
| _CPM_Rate |  |
| CZT Counter | 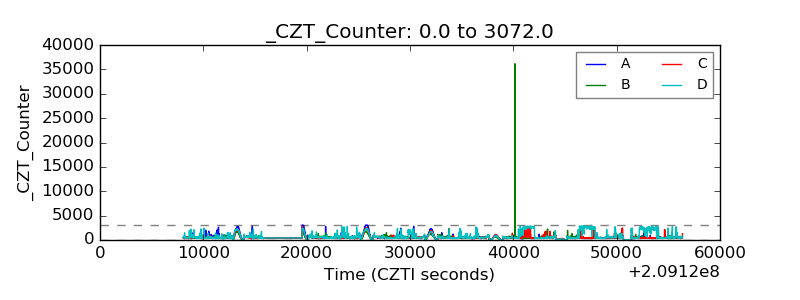 |
| +2.5 Volts monitor |  |
| +5 Volts monitor |  |
| _ROLL_ROT |  |
| _Roll_DEC |  |
| _Roll_RA |  |
| Veto Counter | 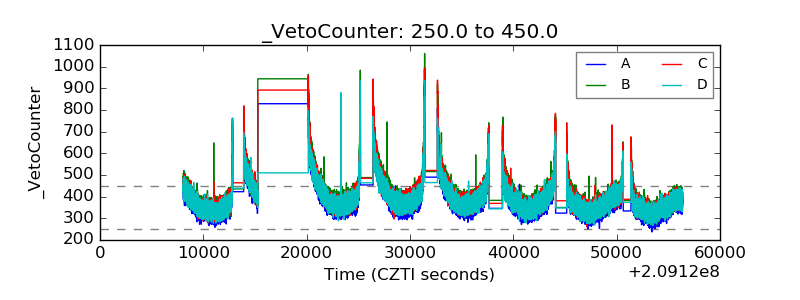 |