| Param | Original file | Final file |
|---|---|---|
| Filename | modeM0/AS1G05_156T09_9000000604cztM0_level2_bc.evt | modeM0/AS1G05_156T09_9000000604cztM0_level2_quad_clean.evt |
| Size (bytes) | 3,282,255,360 | 976,098,240 |
| Size | 3.1 GB | 930.9 MB |
| Events in quadrant A | 19,226,108 | 6,273,348 |
| Events in quadrant B | 21,584,839 | 6,206,563 |
| Events in quadrant C | 23,819,922 | 5,908,179 |
| Events in quadrant D | 29,394,679 | 5,761,018 |
| Mode M9 | |||
|---|---|---|---|
| Quadrant | BADHDUFLAG | Total packets | Discarded packets |
| A | 0 | 120 | 0 |
| B | 0 | 119 | 0 |
| C | 0 | 120 | 0 |
| D | 0 | 120 | 0 |
| Mode M0 | |||
|---|---|---|---|
| Quadrant | BADHDUFLAG | Total packets | Discarded packets |
| A | 0 | 176758 | 0 |
| B | 0 | 182238 | 0 |
| C | 0 | 203499 | 0 |
| D | 0 | 213697 | 0 |
| Mode SS | |||
|---|---|---|---|
| Quadrant | BADHDUFLAG | Total packets | Discarded packets |
| A | 0 | 1612 | 0 |
| B | 0 | 1612 | 0 |
| C | 0 | 1610 | 0 |
| D | 0 | 1608 | 0 |
| Quadrant | Total seconds | Saturated seconds | Saturation percentage |
|---|---|---|---|
| A | 79088 | 2014 | 2.546530% |
| B | 79102 | 1813 | 2.291977% |
| C | 78881 | 5098 | 6.462900% |
| D | 78717 | 4164 | 5.289836% |
Noise dominated data is calculated using 1-second bins in cleaned event files. If a bin has >2000 counts, and if more than 50% of those come from <1% of pixels, then it is considered to be noise-dominated and hence unusable.
| Quadrant | # 1 sec bins | Bins with >0 counts | Bins with >2000 counts | High rate bins dominated by noise | Noise dominated (total time) | Noise dominated (detector-on time) | Marked lightcurve |
|---|---|---|---|---|---|---|---|
| A | 96888 | 79215 | 91 | 91 | 0.09% | 0.11% |  |
| B | 96888 | 79243 | 230 | 230 | 0.24% | 0.29% |  |
| C | 96888 | 78984 | 118 | 118 | 0.12% | 0.15% |  |
| D | 96888 | 78907 | 551 | 551 | 0.57% | 0.70% |  |
Top three noisy pixels from each quadrant. If the there are fewer than three noisy pixels in the level2.evt file, extra rows are filled as -1
| Pixel properties | Quadrant properties | ||||||
|---|---|---|---|---|---|---|---|
| Quadrant | DetID | PixID | Counts | Sigma | Mean | Median | Sigma |
| A | 0 | 50 | 1896721 | 2254.33 | 3765 | 3684 | 839.7 |
| A | 8 | 15 | 973612 | 1155.04 | 3765 | 3684 | 839.7 |
| A | 14 | 238 | 890799 | 1056.42 | 3765 | 3684 | 839.7 |
| B | 14 | 167 | 2617199 | 3581.1 | 3774 | 3661 | 729.8 |
| B | 8 | 3 | 1269911 | 1735.03 | 3774 | 3661 | 729.8 |
| B | 15 | 204 | 1009702 | 1378.49 | 3774 | 3661 | 729.8 |
| C | 14 | 48 | 6426670 | 7854.43 | 3591 | 3522 | 817.8 |
| C | 8 | 208 | 2924275 | 3571.59 | 3591 | 3522 | 817.8 |
| C | 1 | 16 | 234651 | 282.63 | 3591 | 3522 | 817.8 |
| D | 11 | 132 | 5220438 | 6027.13 | 3660 | 3515 | 865.6 |
| D | 13 | 235 | 2809301 | 3241.53 | 3660 | 3515 | 865.6 |
| D | 2 | 136 | 1614454 | 1861.12 | 3660 | 3515 | 865.6 |
Histogram calculated using DETX and DETY for each event in the final _common_clean file
| Quadrant A | 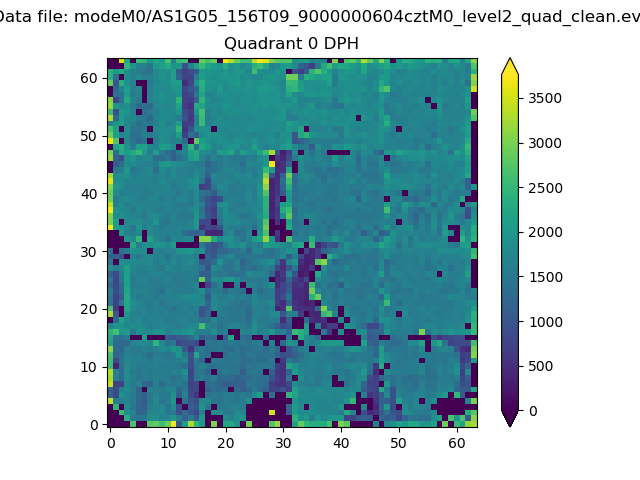 |
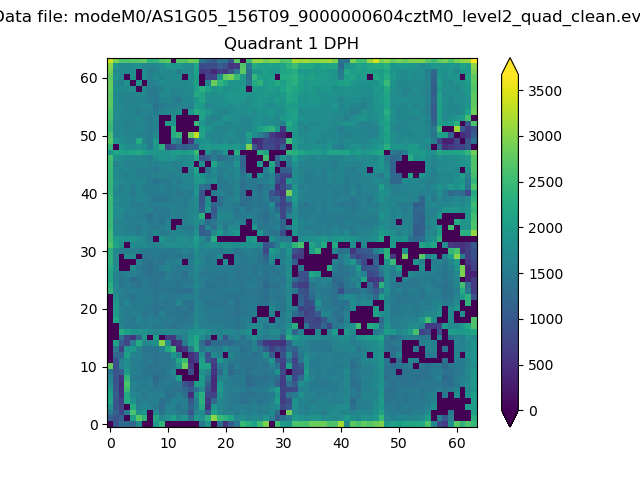 |
Quadrant B |
|---|---|---|---|
| Quadrant D |  |
 |
Quadrant C |
| Plot type | Count rate plots | Images |
|---|---|---|
| Comparison with Poisson distribution Blue bars denote a histogram of data divided into 1 sec bins. Red curve is a Poisson curve with rate = median count rate of data. |
 |
 |
| Quadrant-wise count rates Data is divided into 100 sec bins |
 |
|
| Module-wise count rates for Quadrant A Data is divided into 100 sec bins |
 |
 |
| Module-wise count rates for Quadrant B Data is divided into 100 sec bins |
 |
 |
| Module-wise count rates for Quadrant C Data is divided into 100 sec bins |
 |
 |
| Module-wise count rates for Quadrant D Data is divided into 100 sec bins |
 |
 |
| Parameter | Plot |
|---|---|
| CZT HV Monitor |  |
| D_VDD |  |
| Temperature 1 |  |
| Veto HV Monitor |  |
| Veto LLD |  |
| Alpha Counter |  |
| _CPM_Rate |  |
| CZT Counter |  |
| +2.5 Volts monitor |  |
| +5 Volts monitor |  |
| _ROLL_ROT |  |
| _Roll_DEC |  |
| _Roll_RA |  |
| Veto Counter |  |