| Param | Original file | Final file |
|---|---|---|
| Filename | modeM0/AS1G05_218T05_9000000602cztM0_level2.evt | modeM0/AS1G05_218T05_9000000602cztM0_level2_quad_clean.evt |
| Size (bytes) | 5,024,995,200 | 675,858,240 |
| Size | 4.7 GB | 644.5 MB |
| Events in quadrant A | 26,407,843 | 4,332,085 |
| Events in quadrant B | 27,070,475 | 4,377,646 |
| Events in quadrant C | 50,234,196 | 3,951,621 |
| Events in quadrant D | 44,771,908 | 4,033,972 |
| Mode M0 | |||
|---|---|---|---|
| Quadrant | BADHDUFLAG | Total packets | Discarded packets |
| A | 0 | 116979 | 0 |
| B | 0 | 117755 | 0 |
| C | 0 | 187735 | 0 |
| D | 0 | 171833 | 0 |
| Mode M9 | |||
|---|---|---|---|
| Quadrant | BADHDUFLAG | Total packets | Discarded packets |
| A | 0 | 88 | 0 |
| B | 0 | 88 | 0 |
| C | 0 | 88 | 0 |
| D | 0 | 88 | 0 |
| Mode SS | |||
|---|---|---|---|
| Quadrant | BADHDUFLAG | Total packets | Discarded packets |
| A | 0 | 1120 | 0 |
| B | 0 | 1120 | 0 |
| C | 0 | 1120 | 0 |
| D | 0 | 1120 | 0 |
| Quadrant | Total seconds | Saturated seconds | Saturation percentage |
|---|---|---|---|
| A | 54975 | 1738 | 3.161437% |
| B | 54975 | 500 | 0.909504% |
| C | 54974 | 8702 | 15.829301% |
| D | 54973 | 2848 | 5.180725% |
Noise dominated data is calculated using 1-second bins in cleaned event files. If a bin has >2000 counts, and if more than 50% of those come from <1% of pixels, then it is considered to be noise-dominated and hence unusable.
| Quadrant | # 1 sec bins | Bins with >0 counts | Bins with >2000 counts | High rate bins dominated by noise | Noise dominated (total time) | Noise dominated (detector-on time) | Marked lightcurve |
|---|---|---|---|---|---|---|---|
| A | 78490 | 54984 | 101 | 101 | 0.13% | 0.18% |  |
| B | 78490 | 54986 | 50 | 50 | 0.06% | 0.09% |  |
| C | 78490 | 54985 | 6493 | 6493 | 8.27% | 11.81% |  |
| D | 78490 | 54984 | 2183 | 2183 | 2.78% | 3.97% |  |
Top three noisy pixels from each quadrant. If the there are fewer than three noisy pixels in the level2.evt file, extra rows are filled as -1
| Pixel properties | Quadrant properties | ||||||
|---|---|---|---|---|---|---|---|
| Quadrant | DetID | PixID | Counts | Sigma | Mean | Median | Sigma |
| A | 8 | 15 | 737874 | 582.78 | 6266 | 6136 | 1255.6 |
| A | 14 | 111 | 735990 | 581.28 | 6266 | 6136 | 1255.6 |
| A | 0 | 50 | 585950 | 461.78 | 6266 | 6136 | 1255.6 |
| B | 4 | 80 | 998206 | 823.48 | 6365 | 6210 | 1204.6 |
| B | 14 | 167 | 896015 | 738.65 | 6365 | 6210 | 1204.6 |
| B | 15 | 204 | 224119 | 180.89 | 6365 | 6210 | 1204.6 |
| C | 14 | 48 | 27447029 | 20661.33 | 5752 | 5774 | 1328.1 |
| C | 1 | 16 | 260262 | 191.61 | 5752 | 5774 | 1328.1 |
| C | 9 | 237 | 54475 | 36.67 | 5752 | 5774 | 1328.1 |
| D | 11 | 132 | 13978685 | 9671.47 | 6031 | 5857 | 1444.7 |
| D | 13 | 235 | 4217036 | 2914.82 | 6031 | 5857 | 1444.7 |
| D | 2 | 136 | 1208426 | 832.37 | 6031 | 5857 | 1444.7 |
Histogram calculated using DETX and DETY for each event in the final _common_clean file
| Quadrant A |  |
 |
Quadrant B |
|---|---|---|---|
| Quadrant D | 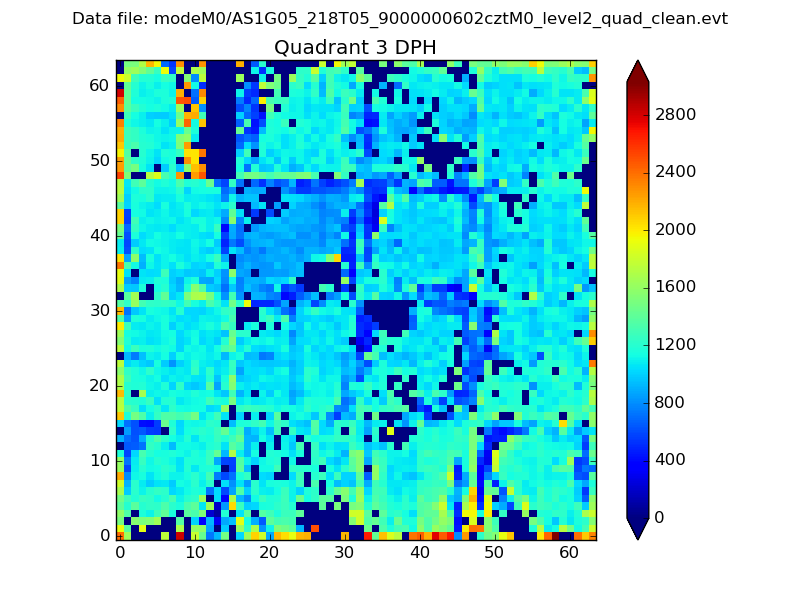 |
 |
Quadrant C |
| Plot type | Count rate plots | Images |
|---|---|---|
| Comparison with Poisson distribution Blue bars denote a histogram of data divided into 1 sec bins. Red curve is a Poisson curve with rate = median count rate of data. |
 |
 |
| Quadrant-wise count rates Data is divided into 100 sec bins |
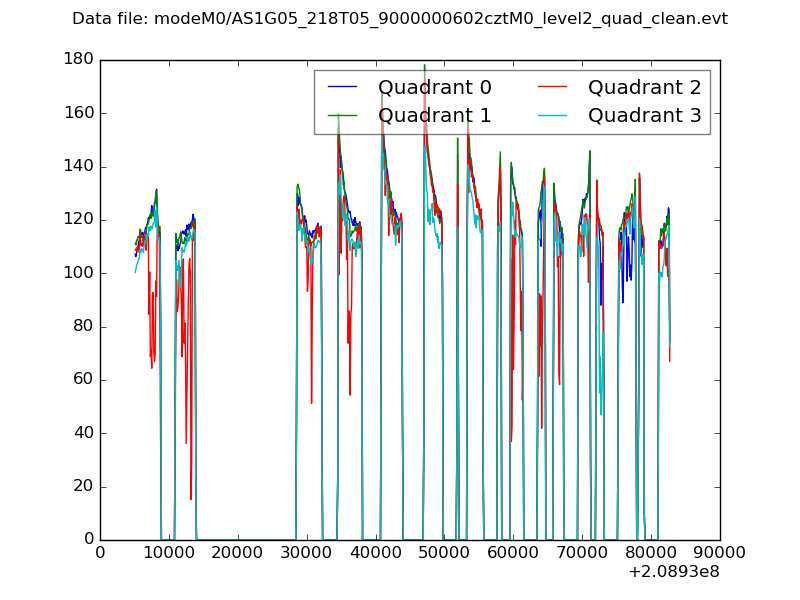 |
|
| Module-wise count rates for Quadrant A Data is divided into 100 sec bins |
 |
 |
| Module-wise count rates for Quadrant B Data is divided into 100 sec bins |
 |
 |
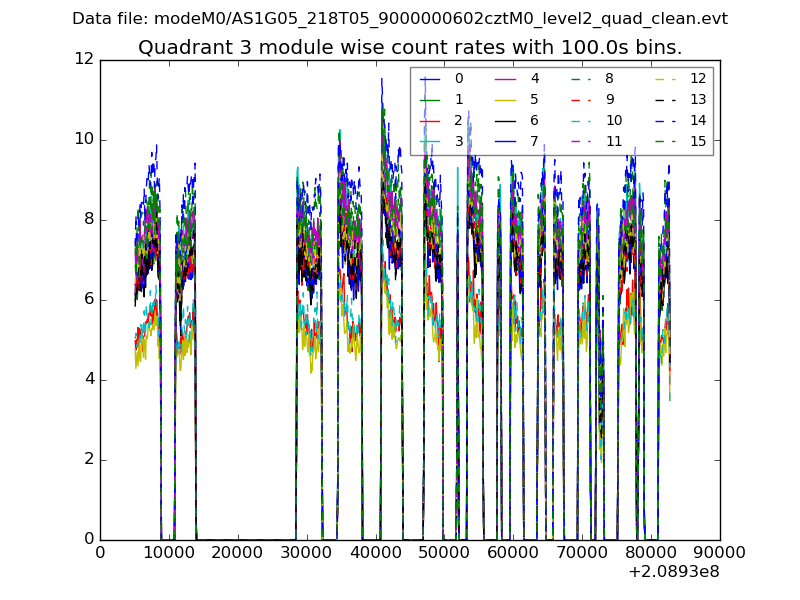
| Module-wise count rates for Quadrant C Data is divided into 100 sec bins |
 |
 |
| Module-wise count rates for Quadrant D Data is divided into 100 sec bins |
 |
 |
| Parameter | Plot |
|---|---|
| CZT HV Monitor |  |
| D_VDD | 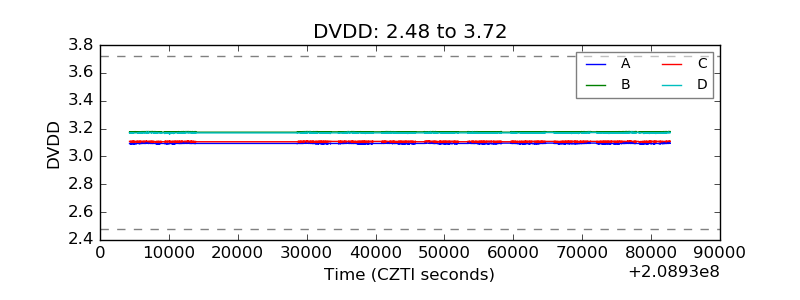 |
| Temperature 1 |  |
| Veto HV Monitor |  |
| Veto LLD |  |
| Alpha Counter |  |
| _CPM_Rate |  |
| CZT Counter |  |
| +2.5 Volts monitor |  |
| +5 Volts monitor |  |
| _ROLL_ROT |  |
| _Roll_DEC |  |
| _Roll_RA |  |
| Veto Counter |  |