| Param | Original file | Final file |
|---|---|---|
| Filename | modeM0/AS1G05_212T01_9000000600cztM0_level2_bc.evt | modeM0/AS1G05_212T01_9000000600cztM0_level2_quad_clean.evt |
| Size (bytes) | 1,662,914,880 | 481,913,280 |
| Size | 1.5 GB | 459.6 MB |
| Events in quadrant A | 7,016,143 | 3,100,757 |
| Events in quadrant B | 9,572,386 | 3,101,952 |
| Events in quadrant C | 15,494,612 | 2,974,559 |
| Events in quadrant D | 15,802,091 | 2,921,883 |
| Mode M9 | |||
|---|---|---|---|
| Quadrant | BADHDUFLAG | Total packets | Discarded packets |
| A | 0 | 60 | 0 |
| B | 0 | 60 | 0 |
| C | 0 | 60 | 0 |
| D | 0 | 60 | 0 |
| Mode M0 | |||
|---|---|---|---|
| Quadrant | BADHDUFLAG | Total packets | Discarded packets |
| A | 0 | 74438 | 0 |
| B | 0 | 81755 | 0 |
| C | 0 | 103468 | 0 |
| D | 0 | 101848 | 0 |
| Mode SS | |||
|---|---|---|---|
| Quadrant | BADHDUFLAG | Total packets | Discarded packets |
| A | 0 | 738 | 0 |
| B | 0 | 738 | 0 |
| C | 0 | 738 | 0 |
| D | 0 | 738 | 0 |
| Quadrant | Total seconds | Saturated seconds | Saturation percentage |
|---|---|---|---|
| A | 36365 | 211 | 0.580228% |
| B | 36364 | 596 | 1.638984% |
| C | 36367 | 1773 | 4.875299% |
| D | 36362 | 1387 | 3.814422% |
Noise dominated data is calculated using 1-second bins in cleaned event files. If a bin has >2000 counts, and if more than 50% of those come from <1% of pixels, then it is considered to be noise-dominated and hence unusable.
| Quadrant | # 1 sec bins | Bins with >0 counts | Bins with >2000 counts | High rate bins dominated by noise | Noise dominated (total time) | Noise dominated (detector-on time) | Marked lightcurve |
|---|---|---|---|---|---|---|---|
| A | 42165 | 36372 | 3 | 3 | 0.01% | 0.01% | 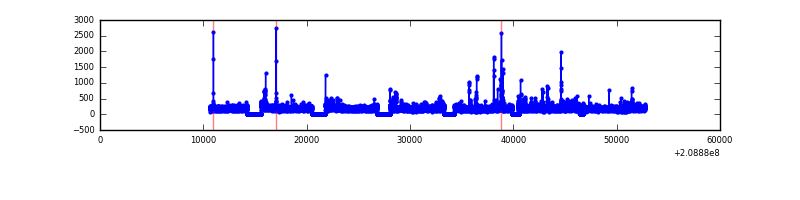 |
| B | 42165 | 36372 | 111 | 111 | 0.26% | 0.31% |  |
| C | 42165 | 36362 | 138 | 138 | 0.33% | 0.38% |  |
| D | 42165 | 36371 | 342 | 342 | 0.81% | 0.94% |  |
Top three noisy pixels from each quadrant. If the there are fewer than three noisy pixels in the level2.evt file, extra rows are filled as -1
| Pixel properties | Quadrant properties | ||||||
|---|---|---|---|---|---|---|---|
| Quadrant | DetID | PixID | Counts | Sigma | Mean | Median | Sigma |
| A | 8 | 15 | 137875 | 349.79 | 1746 | 1707 | 389.3 |
| A | 0 | 149 | 38813 | 95.32 | 1746 | 1707 | 389.3 |
| A | 0 | 50 | 27204 | 65.5 | 1746 | 1707 | 389.3 |
| B | 14 | 167 | 1289218 | 3806.48 | 1764 | 1718 | 338.2 |
| B | 10 | 16 | 631070 | 1860.67 | 1764 | 1718 | 338.2 |
| B | 4 | 80 | 385552 | 1134.8 | 1764 | 1718 | 338.2 |
| C | 14 | 48 | 8697657 | 23257.74 | 1671 | 1645 | 373.9 |
| C | 1 | 16 | 207828 | 551.44 | 1671 | 1645 | 373.9 |
| C | 12 | 4 | 28753 | 72.5 | 1671 | 1645 | 373.9 |
| D | 11 | 132 | 6348901 | 15506.04 | 1706 | 1637 | 409.3 |
| D | 13 | 235 | 1384954 | 3379.37 | 1706 | 1637 | 409.3 |
| D | 2 | 136 | 848803 | 2069.58 | 1706 | 1637 | 409.3 |
Histogram calculated using DETX and DETY for each event in the final _common_clean file
| Quadrant A | 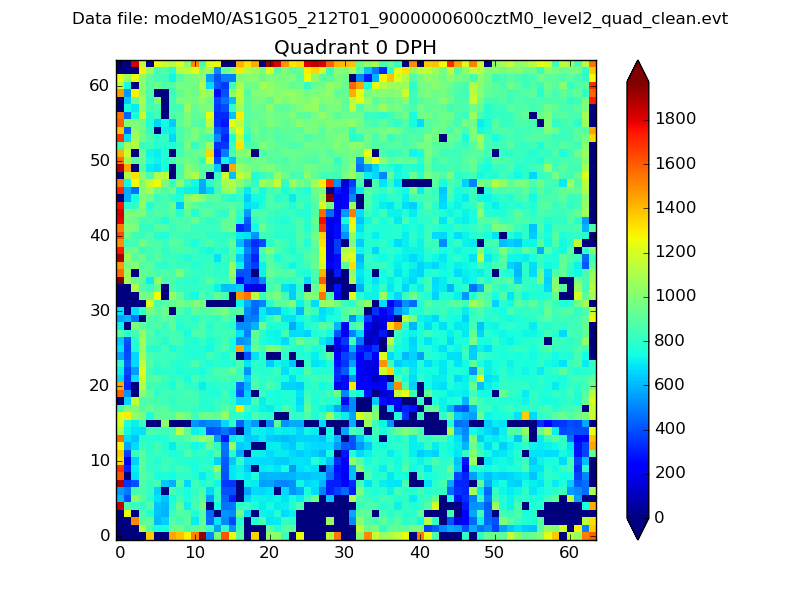 |
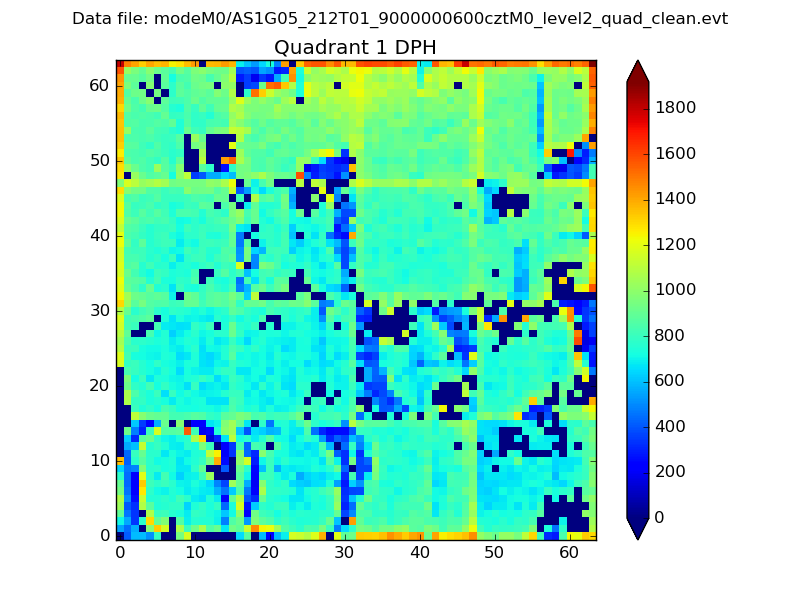 |
Quadrant B |
|---|---|---|---|
| Quadrant D |  |
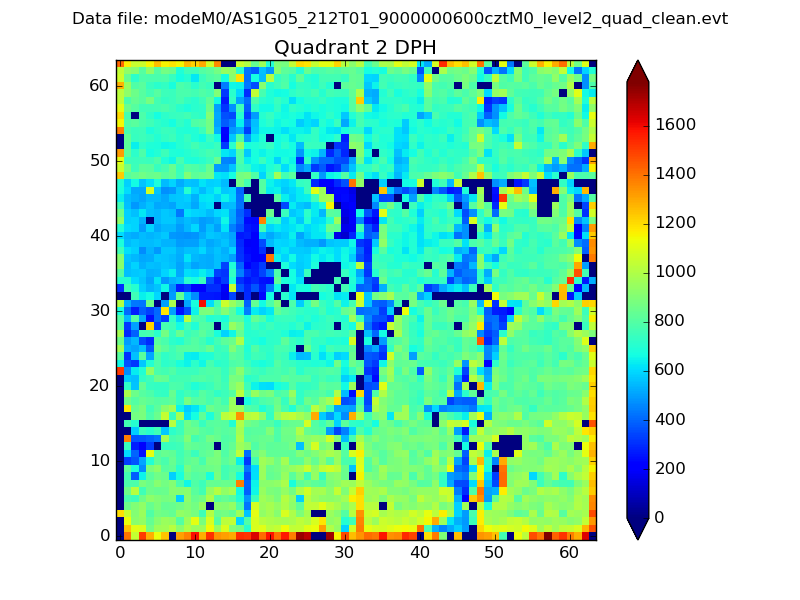 |
Quadrant C |
| Plot type | Count rate plots | Images |
|---|---|---|
| Comparison with Poisson distribution Blue bars denote a histogram of data divided into 1 sec bins. Red curve is a Poisson curve with rate = median count rate of data. |
 |
 |
| Quadrant-wise count rates Data is divided into 100 sec bins |
 |
|
| Module-wise count rates for Quadrant A Data is divided into 100 sec bins |
 |
 |
| Module-wise count rates for Quadrant B Data is divided into 100 sec bins |
 |
 |
| Module-wise count rates for Quadrant C Data is divided into 100 sec bins |
 |
 |
| Module-wise count rates for Quadrant D Data is divided into 100 sec bins |
 |
 |
| Parameter | Plot |
|---|---|
| CZT HV Monitor | 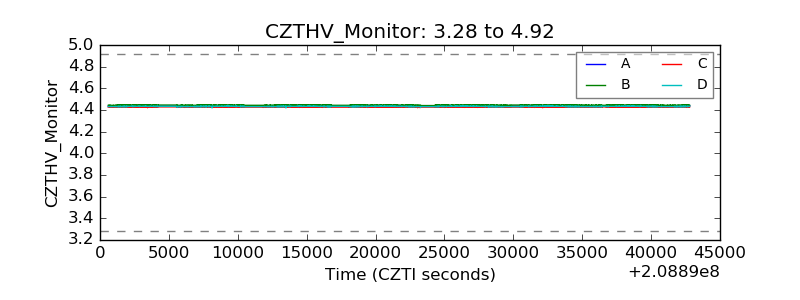 |
| D_VDD |  |
| Temperature 1 |  |
| Veto HV Monitor |  |
| Veto LLD | 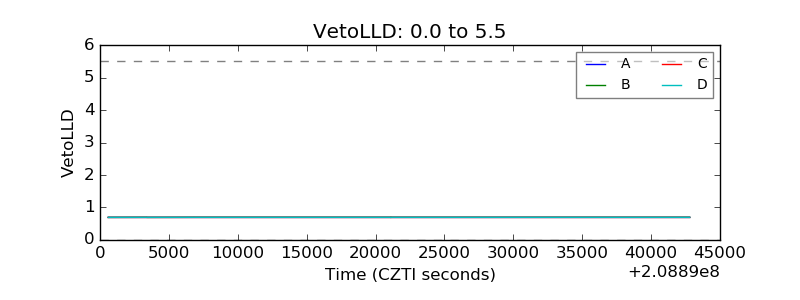 |
| Alpha Counter |  |
| _CPM_Rate |  |
| CZT Counter |  |
| +2.5 Volts monitor | 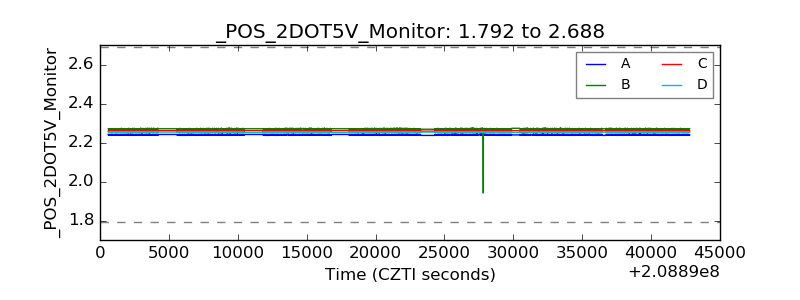 |
| +5 Volts monitor |  |
| _ROLL_ROT |  |
| _Roll_DEC | 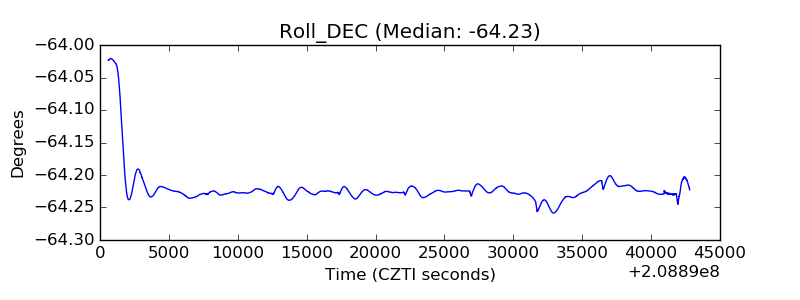 |
| _Roll_RA |  |
| Veto Counter |  |