| Param | Original file | Final file |
|---|---|---|
| Filename | modeM0/AS1G05_195T01_9000000598cztM0_level2_bc.evt | modeM0/AS1G05_195T01_9000000598cztM0_level2_quad_clean.evt |
| Size (bytes) | 2,418,370,560 | 743,880,960 |
| Size | 2.3 GB | 709.4 MB |
| Events in quadrant A | 13,009,848 | 4,488,772 |
| Events in quadrant B | 17,492,503 | 4,468,573 |
| Events in quadrant C | 16,996,233 | 4,529,198 |
| Events in quadrant D | 21,031,049 | 4,304,814 |
| Mode SS | |||
|---|---|---|---|
| Quadrant | BADHDUFLAG | Total packets | Discarded packets |
| A | 0 | 1410 | 0 |
| B | 0 | 1410 | 0 |
| C | 0 | 1408 | 0 |
| D | 0 | 1410 | 0 |
| Mode M9 | |||
|---|---|---|---|
| Quadrant | BADHDUFLAG | Total packets | Discarded packets |
| A | 0 | 106 | 0 |
| B | 0 | 106 | 0 |
| C | 0 | 106 | 0 |
| D | 0 | 106 | 0 |
| Mode M0 | |||
|---|---|---|---|
| Quadrant | BADHDUFLAG | Total packets | Discarded packets |
| A | 0 | 141856 | 0 |
| B | 0 | 155158 | 0 |
| C | 0 | 152540 | 0 |
| D | 0 | 167822 | 0 |
| Quadrant | Total seconds | Saturated seconds | Saturation percentage |
|---|---|---|---|
| A | 69099 | 758 | 1.096977% |
| B | 69087 | 1694 | 2.451981% |
| C | 69094 | 1451 | 2.100038% |
| D | 69076 | 2151 | 3.113961% |
Noise dominated data is calculated using 1-second bins in cleaned event files. If a bin has >2000 counts, and if more than 50% of those come from <1% of pixels, then it is considered to be noise-dominated and hence unusable.
| Quadrant | # 1 sec bins | Bins with >0 counts | Bins with >2000 counts | High rate bins dominated by noise | Noise dominated (total time) | Noise dominated (detector-on time) | Marked lightcurve |
|---|---|---|---|---|---|---|---|
| A | 79879 | 69131 | 5 | 5 | 0.01% | 0.01% | 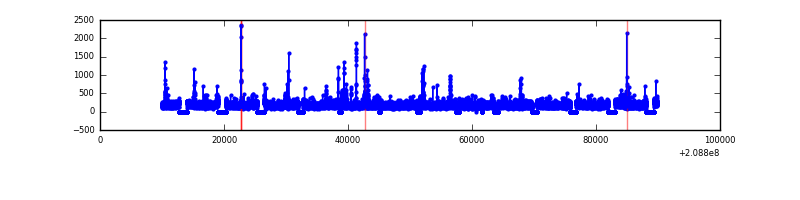 |
| B | 79879 | 69130 | 234 | 234 | 0.29% | 0.34% |  |
| C | 79879 | 69139 | 305 | 305 | 0.38% | 0.44% |  |
| D | 79879 | 69117 | 557 | 557 | 0.70% | 0.81% |  |
Top three noisy pixels from each quadrant. If the there are fewer than three noisy pixels in the level2.evt file, extra rows are filled as -1
| Pixel properties | Quadrant properties | ||||||
|---|---|---|---|---|---|---|---|
| Quadrant | DetID | PixID | Counts | Sigma | Mean | Median | Sigma |
| A | 13 | 251 | 82312 | 107.73 | 3286 | 3210 | 734.2 |
| A | 0 | 149 | 60530 | 78.07 | 3286 | 3210 | 734.2 |
| A | 0 | 50 | 50246 | 64.06 | 3286 | 3210 | 734.2 |
| B | 10 | 16 | 2069983 | 3243.91 | 3300 | 3195 | 637.1 |
| B | 14 | 167 | 1459160 | 2285.2 | 3300 | 3195 | 637.1 |
| B | 15 | 204 | 395112 | 615.13 | 3300 | 3195 | 637.1 |
| C | 14 | 48 | 3733803 | 5125.1 | 3228 | 3165 | 727.9 |
| C | 1 | 16 | 238967 | 323.94 | 3228 | 3165 | 727.9 |
| C | 12 | 4 | 106973 | 142.61 | 3228 | 3165 | 727.9 |
| D | 11 | 132 | 4753364 | 6270.83 | 3213 | 3080 | 757.5 |
| D | 13 | 235 | 1023435 | 1346.97 | 3213 | 3080 | 757.5 |
| D | 13 | 239 | 590941 | 776.03 | 3213 | 3080 | 757.5 |
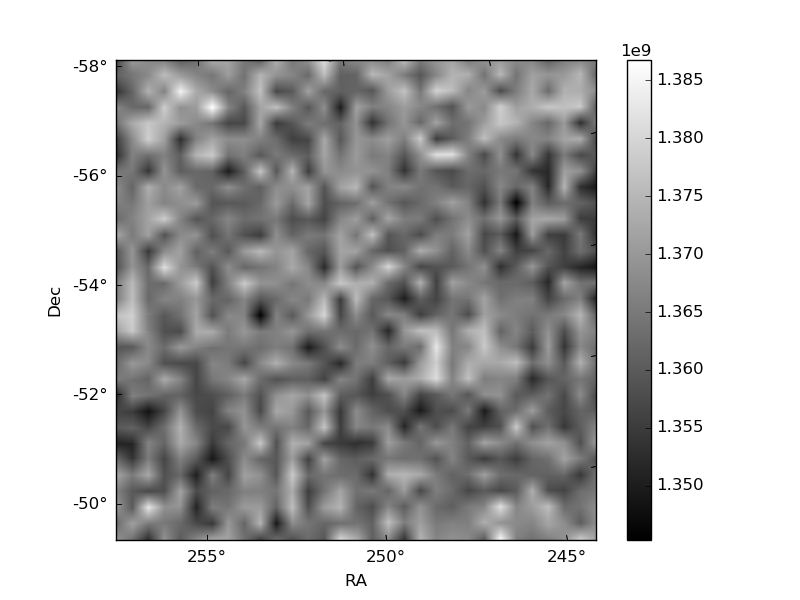
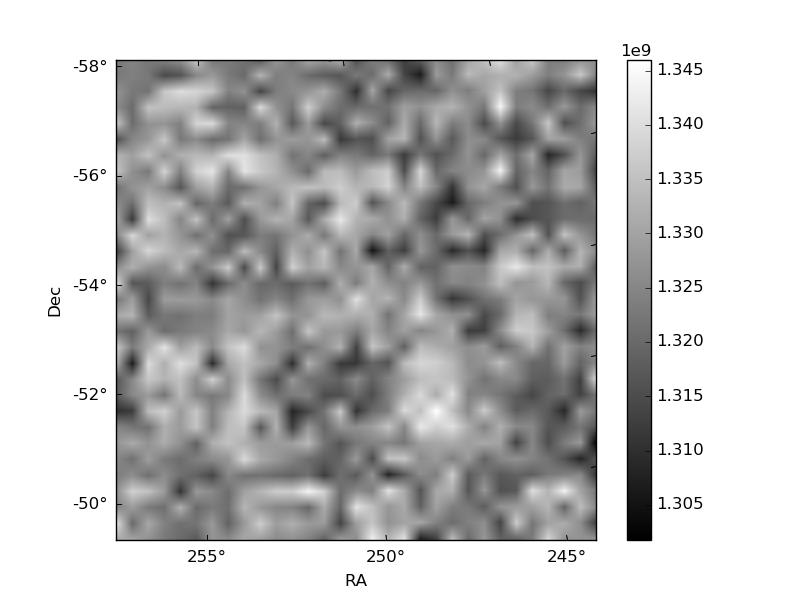
Histogram calculated using DETX and DETY for each event in the final _common_clean file
| Quadrant A |  |
 |
Quadrant B |
|---|---|---|---|
| Quadrant D |  |
 |
Quadrant C |
| Plot type | Count rate plots | Images |
|---|---|---|
| Comparison with Poisson distribution Blue bars denote a histogram of data divided into 1 sec bins. Red curve is a Poisson curve with rate = median count rate of data. |
 |
 |
| Quadrant-wise count rates Data is divided into 100 sec bins |
 |
|
| Module-wise count rates for Quadrant A Data is divided into 100 sec bins |
 |
 |
| Module-wise count rates for Quadrant B Data is divided into 100 sec bins |
 |
 |
| Module-wise count rates for Quadrant C Data is divided into 100 sec bins |
 |
 |
| Module-wise count rates for Quadrant D Data is divided into 100 sec bins |
 |
 |
| Parameter | Plot |
|---|---|
| CZT HV Monitor | 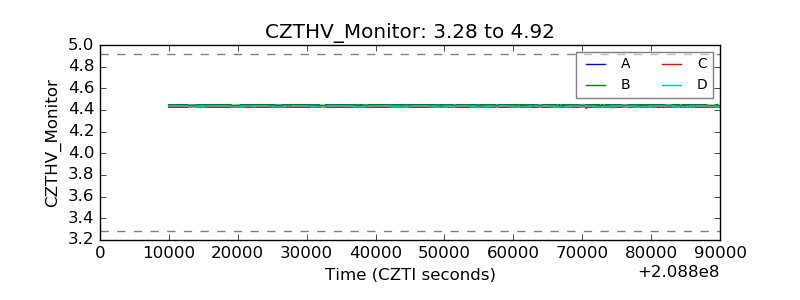 |
| D_VDD |  |
| Temperature 1 |  |
| Veto HV Monitor |  |
| Veto LLD | 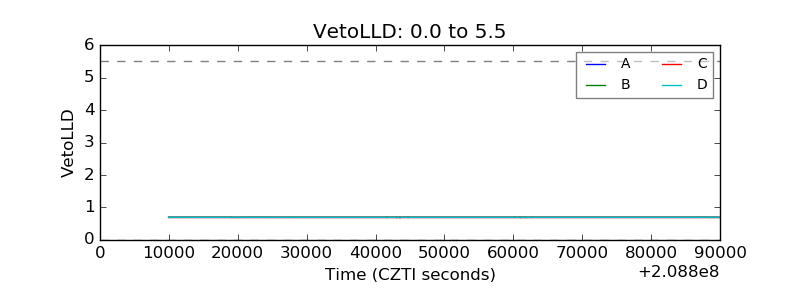 |
| Alpha Counter |  |
| _CPM_Rate |  |
| CZT Counter |  |
| +2.5 Volts monitor | 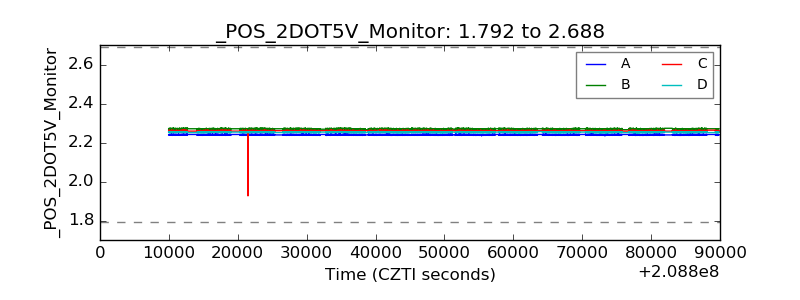 |
| +5 Volts monitor |  |
| _ROLL_ROT |  |
| _Roll_DEC |  |
| _Roll_RA | 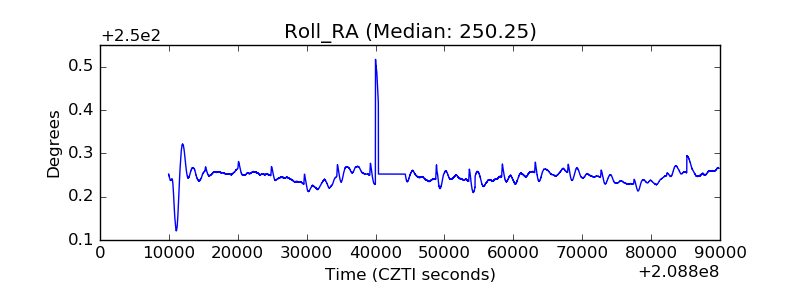 |
| Veto Counter |  |