| Param | Original file | Final file |
|---|---|---|
| Filename | modeM0/AS1G05_192T01_9000000594cztM0_level2.evt | modeM0/AS1G05_192T01_9000000594cztM0_level2_quad_clean.evt |
| Size (bytes) | 4,572,264,960 | 625,656,960 |
| Size | 4.3 GB | 596.7 MB |
| Events in quadrant A | 21,650,614 | 4,278,739 |
| Events in quadrant B | 23,489,478 | 4,449,960 |
| Events in quadrant C | 53,616,808 | 3,048,414 |
| Events in quadrant D | 36,529,431 | 3,920,587 |
| Mode SS | |||
|---|---|---|---|
| Quadrant | BADHDUFLAG | Total packets | Discarded packets |
| A | 0 | 992 | 0 |
| B | 0 | 992 | 0 |
| C | 0 | 992 | 0 |
| D | 0 | 993 | 0 |
| Mode M0 | |||
|---|---|---|---|
| Quadrant | BADHDUFLAG | Total packets | Discarded packets |
| A | 0 | 98415 | 0 |
| B | 0 | 102528 | 0 |
| C | 0 | 191830 | 0 |
| D | 0 | 142331 | 0 |
| Mode M9 | |||
|---|---|---|---|
| Quadrant | BADHDUFLAG | Total packets | Discarded packets |
| A | 0 | 93 | 0 |
| B | 0 | 93 | 0 |
| C | 0 | 93 | 0 |
| D | 0 | 94 | 0 |
| Quadrant | Total seconds | Saturated seconds | Saturation percentage |
|---|---|---|---|
| A | 47395 | 538 | 1.135141% |
| B | 47397 | 767 | 1.618246% |
| C | 47188 | 11039 | 23.393659% |
| D | 47139 | 4867 | 10.324784% |
Noise dominated data is calculated using 1-second bins in cleaned event files. If a bin has >2000 counts, and if more than 50% of those come from <1% of pixels, then it is considered to be noise-dominated and hence unusable.
| Quadrant | # 1 sec bins | Bins with >0 counts | Bins with >2000 counts | High rate bins dominated by noise | Noise dominated (total time) | Noise dominated (detector-on time) | Marked lightcurve |
|---|---|---|---|---|---|---|---|
| A | 61647 | 47833 | 100 | 100 | 0.16% | 0.21% | 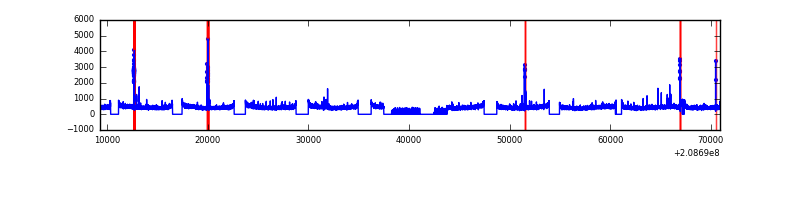 |
| B | 61647 | 47838 | 176 | 176 | 0.29% | 0.37% | 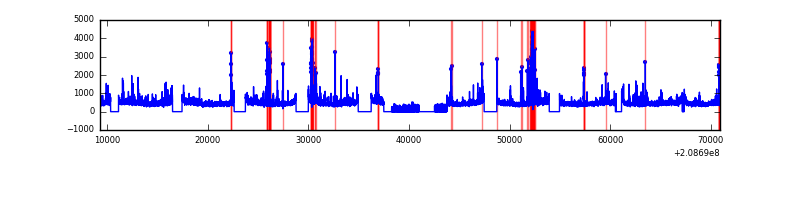 |
| C | 61647 | 47386 | 8965 | 8965 | 14.54% | 18.92% |  |
| D | 61647 | 47322 | 3845 | 3845 | 6.24% | 8.13% |  |
Top three noisy pixels from each quadrant. If the there are fewer than three noisy pixels in the level2.evt file, extra rows are filled as -1
| Pixel properties | Quadrant properties | ||||||
|---|---|---|---|---|---|---|---|
| Quadrant | DetID | PixID | Counts | Sigma | Mean | Median | Sigma |
| A | 0 | 118 | 363450 | 327.54 | 5446 | 5335 | 1093.3 |
| A | 15 | 254 | 124174 | 108.69 | 5446 | 5335 | 1093.3 |
| A | 8 | 15 | 100844 | 87.35 | 5446 | 5335 | 1093.3 |
| B | 10 | 16 | 868007 | 827.61 | 5517 | 5386 | 1042.3 |
| B | 14 | 167 | 769415 | 733.02 | 5517 | 5386 | 1042.3 |
| B | 4 | 80 | 254510 | 239.01 | 5517 | 5386 | 1042.3 |
| C | 14 | 48 | 34510676 | 32555.37 | 4628 | 4650 | 1059.9 |
| C | 8 | 208 | 943005 | 885.31 | 4628 | 4650 | 1059.9 |
| C | 12 | 4 | 47994 | 40.89 | 4628 | 4650 | 1059.9 |
| D | 13 | 53 | 7265911 | 6018.39 | 5031 | 4880 | 1206.5 |
| D | 1 | 31 | 3612941 | 2990.58 | 5031 | 4880 | 1206.5 |
| D | 13 | 235 | 3117899 | 2580.26 | 5031 | 4880 | 1206.5 |
Histogram calculated using DETX and DETY for each event in the final _common_clean file
| Quadrant A | 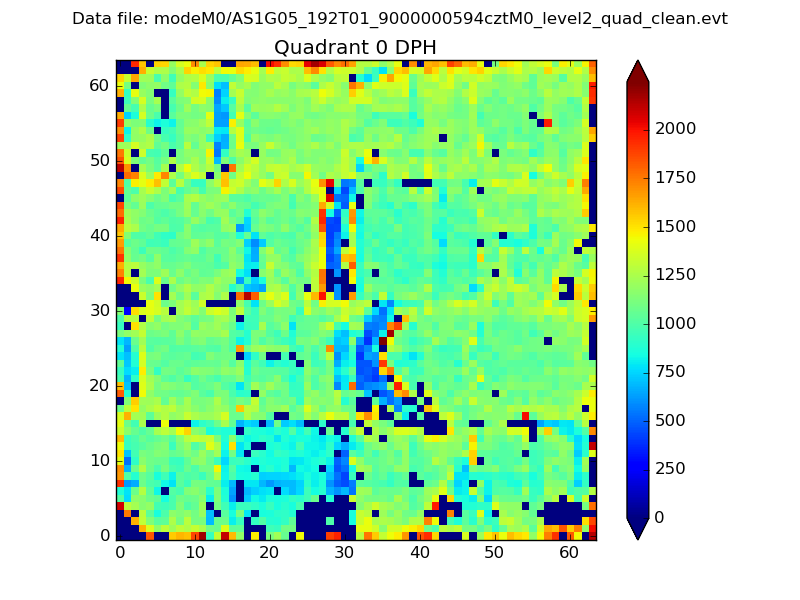 |
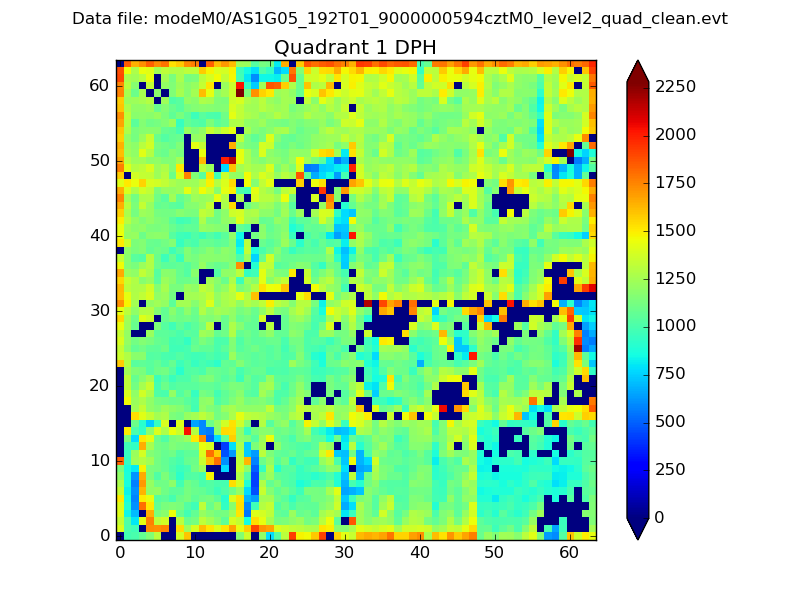 |
Quadrant B |
|---|---|---|---|
| Quadrant D |  |
 |
Quadrant C |
| Plot type | Count rate plots | Images |
|---|---|---|
| Comparison with Poisson distribution Blue bars denote a histogram of data divided into 1 sec bins. Red curve is a Poisson curve with rate = median count rate of data. |
 |
 |
| Quadrant-wise count rates Data is divided into 100 sec bins |
 |
|
| Module-wise count rates for Quadrant A Data is divided into 100 sec bins |
 |
 |
| Module-wise count rates for Quadrant B Data is divided into 100 sec bins |
 |
 |
| Module-wise count rates for Quadrant C Data is divided into 100 sec bins |
 |
 |
| Module-wise count rates for Quadrant D Data is divided into 100 sec bins |
 |
 |
| Parameter | Plot |
|---|---|
| CZT HV Monitor |  |
| D_VDD |  |
| Temperature 1 |  |
| Veto HV Monitor |  |
| Veto LLD |  |
| Alpha Counter |  |
| _CPM_Rate |  |
| CZT Counter |  |
| +2.5 Volts monitor |  |
| +5 Volts monitor |  |
| _ROLL_ROT |  |
| _Roll_DEC |  |
| _Roll_RA |  |
| Veto Counter |  |