| Param | Original file | Final file |
|---|---|---|
| Filename | modeM0/AS1G05_227T01_9000000592cztM0_level2.evt | modeM0/AS1G05_227T01_9000000592cztM0_level2_quad_clean.evt |
| Size (bytes) | 4,315,193,280 | 694,828,800 |
| Size | 4.0 GB | 662.6 MB |
| Events in quadrant A | 26,939,641 | 4,286,011 |
| Events in quadrant B | 32,163,350 | 4,332,689 |
| Events in quadrant C | 29,870,325 | 4,361,864 |
| Events in quadrant D | 37,773,145 | 4,056,735 |
| Mode M0 | |||
|---|---|---|---|
| Quadrant | BADHDUFLAG | Total packets | Discarded packets |
| A | 0 | 121877 | 0 |
| B | 0 | 134841 | 0 |
| C | 0 | 131006 | 0 |
| D | 0 | 152462 | 0 |
| Mode SS | |||
|---|---|---|---|
| Quadrant | BADHDUFLAG | Total packets | Discarded packets |
| A | 0 | 1186 | 0 |
| B | 0 | 1186 | 0 |
| C | 0 | 1186 | 0 |
| D | 0 | 1186 | 0 |
| Mode M9 | |||
|---|---|---|---|
| Quadrant | BADHDUFLAG | Total packets | Discarded packets |
| A | 0 | 97 | 0 |
| B | 0 | 97 | 0 |
| C | 0 | 97 | 0 |
| D | 0 | 97 | 0 |
| Quadrant | Total seconds | Saturated seconds | Saturation percentage |
|---|---|---|---|
| A | 58439 | 751 | 1.285101% |
| B | 58439 | 1585 | 2.712230% |
| C | 58439 | 1431 | 2.448707% |
| D | 58439 | 2294 | 3.925461% |
Noise dominated data is calculated using 1-second bins in cleaned event files. If a bin has >2000 counts, and if more than 50% of those come from <1% of pixels, then it is considered to be noise-dominated and hence unusable.
| Quadrant | # 1 sec bins | Bins with >0 counts | Bins with >2000 counts | High rate bins dominated by noise | Noise dominated (total time) | Noise dominated (detector-on time) | Marked lightcurve |
|---|---|---|---|---|---|---|---|
| A | 74758 | 58451 | 72 | 72 | 0.10% | 0.12% |  |
| B | 74758 | 58451 | 732 | 732 | 0.98% | 1.25% |  |
| C | 74758 | 58451 | 711 | 711 | 0.95% | 1.22% |  |
| D | 74758 | 58450 | 1287 | 1287 | 1.72% | 2.20% | 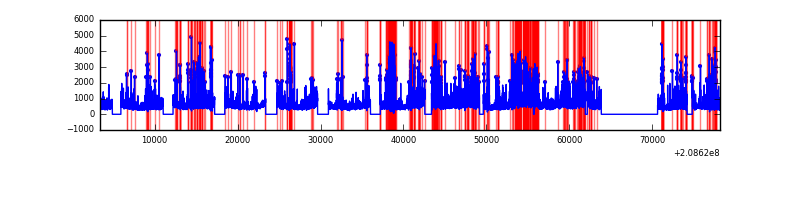 |
Top three noisy pixels from each quadrant. If the there are fewer than three noisy pixels in the level2.evt file, extra rows are filled as -1
| Pixel properties | Quadrant properties | ||||||
|---|---|---|---|---|---|---|---|
| Quadrant | DetID | PixID | Counts | Sigma | Mean | Median | Sigma |
| A | 0 | 118 | 445733 | 316.61 | 6784 | 6638 | 1386.9 |
| A | 0 | 226 | 110508 | 74.9 | 6784 | 6638 | 1386.9 |
| A | 13 | 14 | 109943 | 74.49 | 6784 | 6638 | 1386.9 |
| B | 10 | 16 | 1964956 | 1502.27 | 6841 | 6676 | 1303.6 |
| B | 14 | 167 | 1476128 | 1127.27 | 6841 | 6676 | 1303.6 |
| B | 15 | 204 | 835750 | 636.01 | 6841 | 6676 | 1303.6 |
| C | 14 | 48 | 3525342 | 2317.4 | 6569 | 6603 | 1518.4 |
| C | 9 | 16 | 474519 | 308.16 | 6569 | 6603 | 1518.4 |
| C | 9 | 247 | 124196 | 77.45 | 6569 | 6603 | 1518.4 |
| D | 2 | 63 | 6328458 | 4035.75 | 6464 | 6276 | 1566.5 |
| D | 13 | 235 | 2585391 | 1646.37 | 6464 | 6276 | 1566.5 |
| D | 2 | 136 | 1111249 | 705.36 | 6464 | 6276 | 1566.5 |
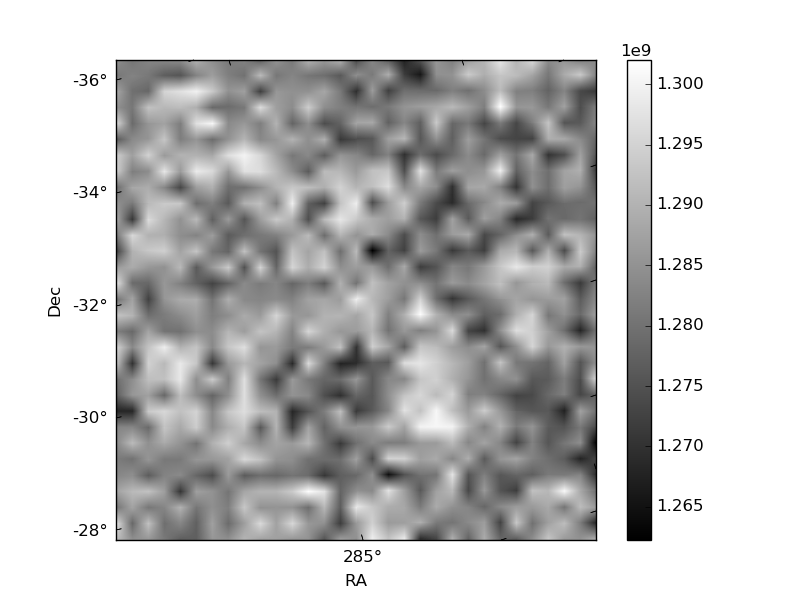
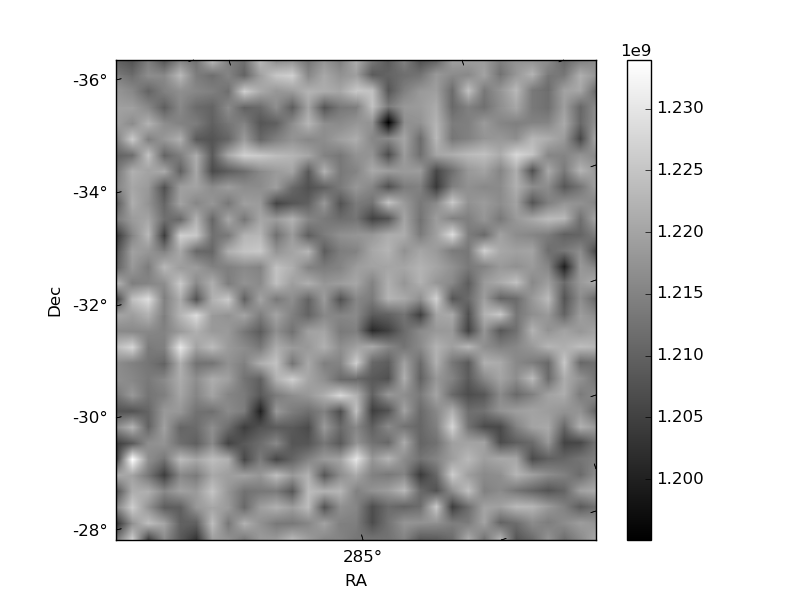
Histogram calculated using DETX and DETY for each event in the final _common_clean file
| Quadrant A |  |
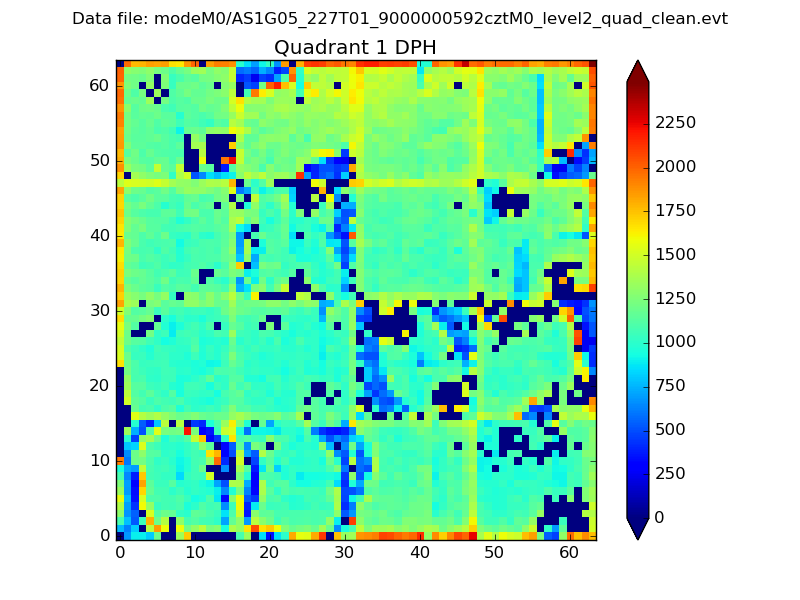 |
Quadrant B |
|---|---|---|---|
| Quadrant D | 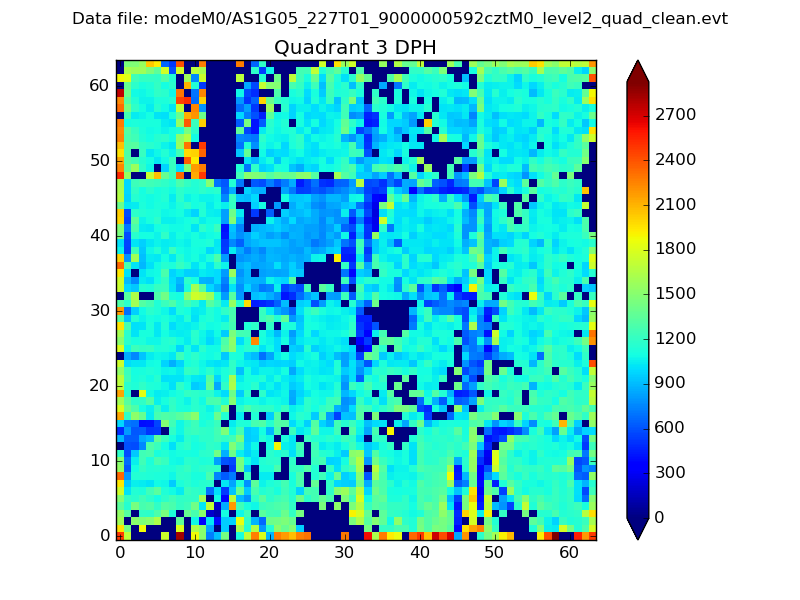 |
 |
Quadrant C |
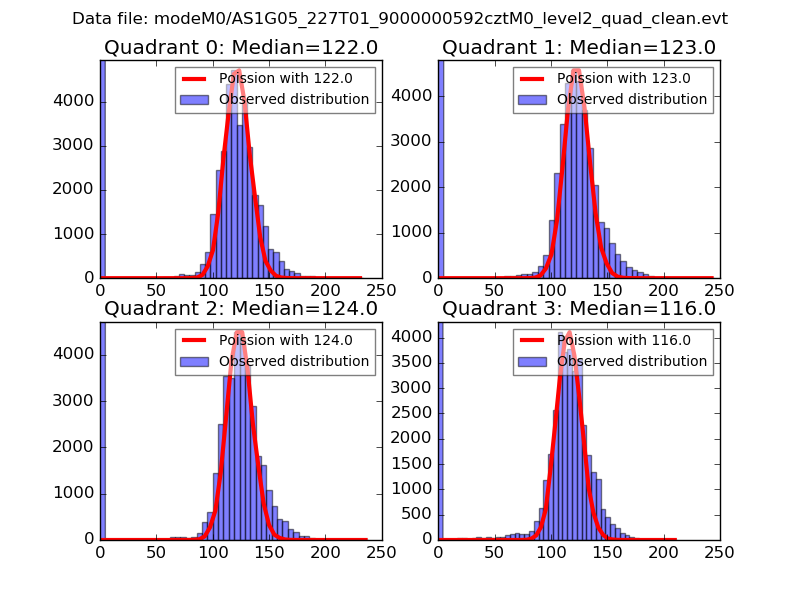
| Plot type | Count rate plots | Images |
|---|---|---|
| Comparison with Poisson distribution Blue bars denote a histogram of data divided into 1 sec bins. Red curve is a Poisson curve with rate = median count rate of data. |
 |
 |
| Quadrant-wise count rates Data is divided into 100 sec bins |
 |
|
| Module-wise count rates for Quadrant A Data is divided into 100 sec bins |
 |
 |
| Module-wise count rates for Quadrant B Data is divided into 100 sec bins |
 |
 |
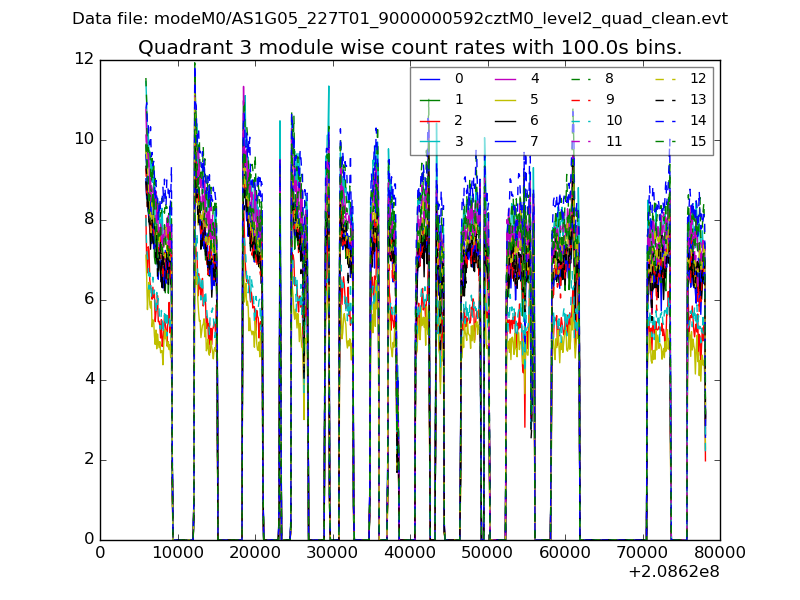
| Module-wise count rates for Quadrant C Data is divided into 100 sec bins |
 |
 |
| Module-wise count rates for Quadrant D Data is divided into 100 sec bins |
 |
 |
| Parameter | Plot |
|---|---|
| CZT HV Monitor |  |
| D_VDD | 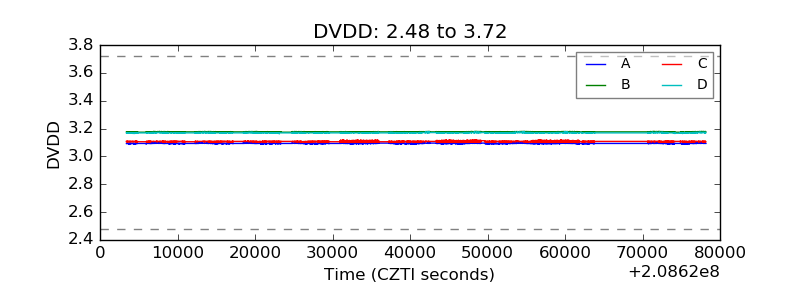 |
| Temperature 1 |  |
| Veto HV Monitor | 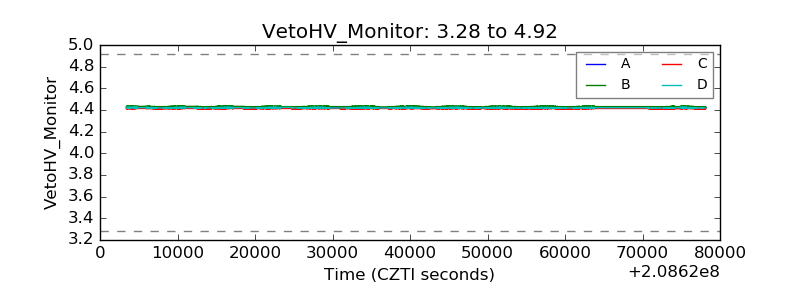 |
| Veto LLD |  |
| Alpha Counter |  |
| _CPM_Rate |  |
| CZT Counter |  |
| +2.5 Volts monitor |  |
| +5 Volts monitor |  |
| _ROLL_ROT |  |
| _Roll_DEC |  |
| _Roll_RA |  |
| Veto Counter | 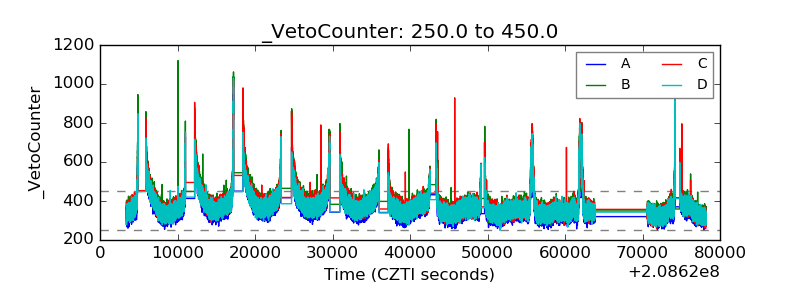 |