| Param | Original file | Final file |
|---|---|---|
| Filename | modeM0/AS1G05_235T01_9000000590cztM0_level2.evt | modeM0/AS1G05_235T01_9000000590cztM0_level2_quad_clean.evt |
| Size (bytes) | 12,286,969,920 | 1,919,329,920 |
| Size | 11.4 GB | 1.8 GB |
| Events in quadrant A | 69,143,950 | 12,272,744 |
| Events in quadrant B | 76,839,228 | 12,414,704 |
| Events in quadrant C | 83,045,477 | 11,969,438 |
| Events in quadrant D | 132,873,853 | 11,086,243 |
| Mode M9 | |||
|---|---|---|---|
| Quadrant | BADHDUFLAG | Total packets | Discarded packets |
| A | 0 | 228 | 0 |
| B | 0 | 228 | 0 |
| C | 0 | 228 | 0 |
| D | 0 | 228 | 0 |
| Mode SS | |||
|---|---|---|---|
| Quadrant | BADHDUFLAG | Total packets | Discarded packets |
| A | 0 | 3086 | 0 |
| B | 0 | 3088 | 0 |
| C | 0 | 3092 | 0 |
| D | 0 | 3092 | 0 |
| Mode M0 | |||
|---|---|---|---|
| Quadrant | BADHDUFLAG | Total packets | Discarded packets |
| A | 0 | 315403 | 0 |
| B | 0 | 331520 | 0 |
| C | 0 | 356516 | 0 |
| D | 0 | 501348 | 0 |
| Quadrant | Total seconds | Saturated seconds | Saturation percentage |
|---|---|---|---|
| A | 151616 | 2483 | 1.637690% |
| B | 151600 | 2905 | 1.916227% |
| C | 151604 | 7290 | 4.808580% |
| D | 151468 | 17196 | 11.352893% |
Noise dominated data is calculated using 1-second bins in cleaned event files. If a bin has >2000 counts, and if more than 50% of those come from <1% of pixels, then it is considered to be noise-dominated and hence unusable.
| Quadrant | # 1 sec bins | Bins with >0 counts | Bins with >2000 counts | High rate bins dominated by noise | Noise dominated (total time) | Noise dominated (detector-on time) | Marked lightcurve |
|---|---|---|---|---|---|---|---|
| A | 175561 | 151790 | 197 | 197 | 0.11% | 0.13% | 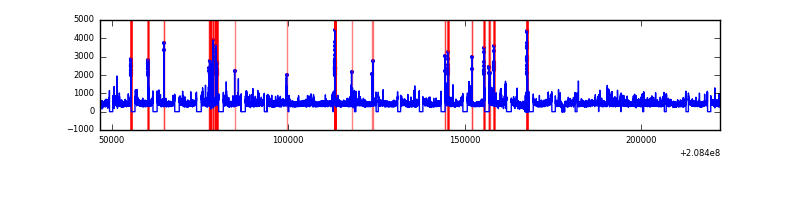 |
| B | 175561 | 151781 | 395 | 395 | 0.22% | 0.26% |  |
| C | 175561 | 151773 | 5146 | 5146 | 2.93% | 3.39% |  |
| D | 175561 | 151684 | 14279 | 14279 | 8.13% | 9.41% |  |
Top three noisy pixels from each quadrant. If the there are fewer than three noisy pixels in the level2.evt file, extra rows are filled as -1
| Pixel properties | Quadrant properties | ||||||
|---|---|---|---|---|---|---|---|
| Quadrant | DetID | PixID | Counts | Sigma | Mean | Median | Sigma |
| A | 15 | 174 | 771664 | 215.7 | 17343 | 16958 | 3498.9 |
| A | 8 | 15 | 562874 | 156.02 | 17343 | 16958 | 3498.9 |
| A | 0 | 50 | 256482 | 68.46 | 17343 | 16958 | 3498.9 |
| B | 15 | 204 | 2469379 | 736.43 | 17581 | 17156 | 3329.9 |
| B | 4 | 80 | 2218229 | 661.01 | 17581 | 17156 | 3329.9 |
| B | 14 | 167 | 1414255 | 419.57 | 17581 | 17156 | 3329.9 |
| C | 9 | 68 | 12943829 | 3333.29 | 16780 | 16831 | 3878.1 |
| C | 14 | 48 | 3254423 | 834.83 | 16780 | 16831 | 3878.1 |
| C | 9 | 247 | 731916 | 184.39 | 16780 | 16831 | 3878.1 |
| D | 2 | 63 | 35687968 | 9174.0 | 16276 | 15788 | 3888.4 |
| D | 13 | 235 | 20702532 | 5320.12 | 16276 | 15788 | 3888.4 |
| D | 2 | 136 | 3037299 | 777.06 | 16276 | 15788 | 3888.4 |
Histogram calculated using DETX and DETY for each event in the final _common_clean file
| Quadrant A | 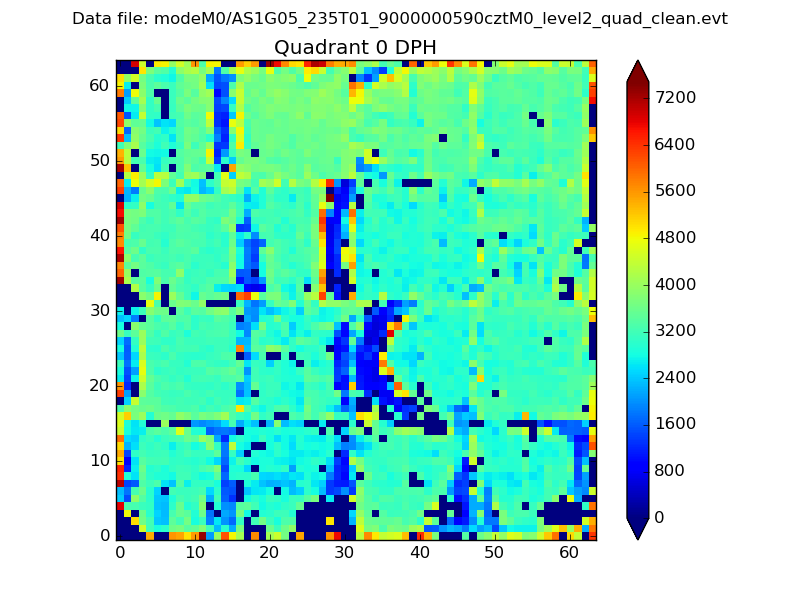 |
 |
Quadrant B |
|---|---|---|---|
| Quadrant D |  |
 |
Quadrant C |
| Plot type | Count rate plots | Images |
|---|---|---|
| Comparison with Poisson distribution Blue bars denote a histogram of data divided into 1 sec bins. Red curve is a Poisson curve with rate = median count rate of data. |
 |
 |
| Quadrant-wise count rates Data is divided into 100 sec bins |
 |
|
| Module-wise count rates for Quadrant A Data is divided into 100 sec bins |
 |
 |
| Module-wise count rates for Quadrant B Data is divided into 100 sec bins |
 |
 |
| Module-wise count rates for Quadrant C Data is divided into 100 sec bins |
 |
 |
| Module-wise count rates for Quadrant D Data is divided into 100 sec bins |
 |
 |
| Parameter | Plot |
|---|---|
| CZT HV Monitor | 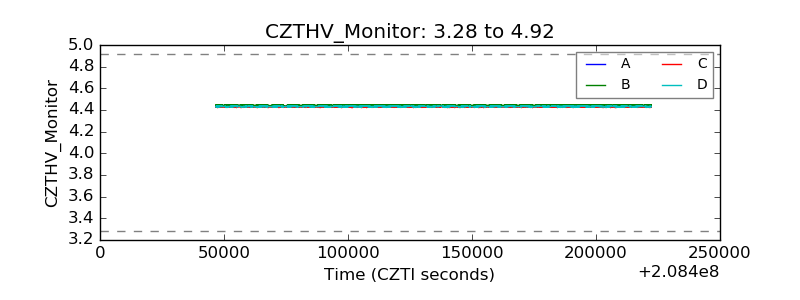 |
| D_VDD |  |
| Temperature 1 |  |
| Veto HV Monitor |  |
| Veto LLD |  |
| Alpha Counter |  |
| _CPM_Rate | 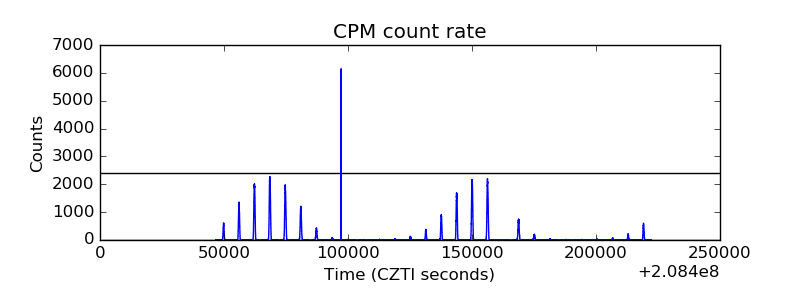 |
| CZT Counter |  |
| +2.5 Volts monitor | 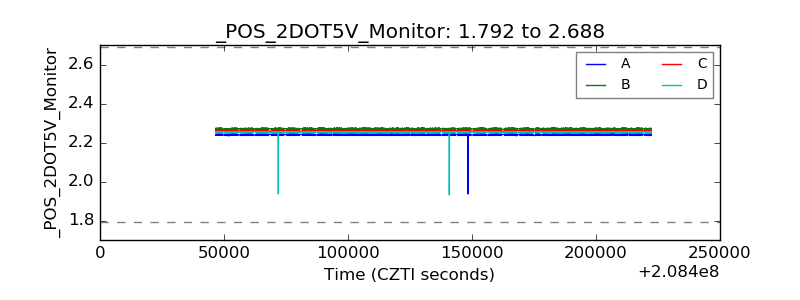 |
| +5 Volts monitor |  |
| _ROLL_ROT |  |
| _Roll_DEC | 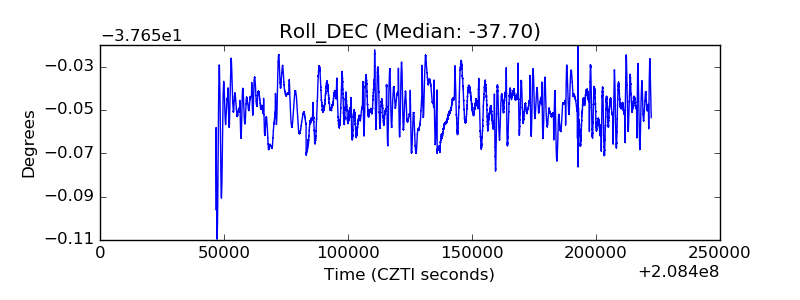 |
| _Roll_RA | 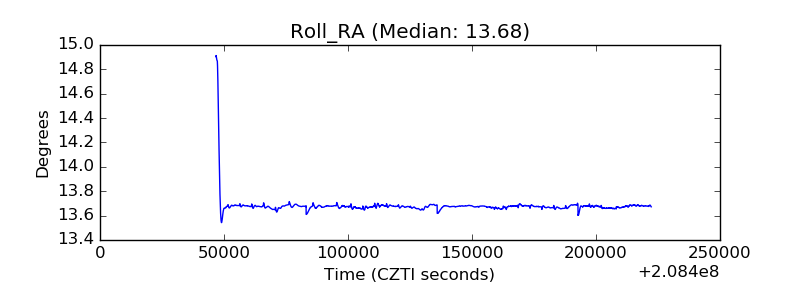 |
| Veto Counter |  |