| Param | Original file | Final file |
|---|---|---|
| Filename | modeM0/AS1G05_251T02_9000000588cztM0_level2.evt | modeM0/AS1G05_251T02_9000000588cztM0_level2_quad_clean.evt |
| Size (bytes) | 5,072,103,360 | 922,242,240 |
| Size | 4.7 GB | 879.5 MB |
| Events in quadrant A | 25,213,470 | 6,315,234 |
| Events in quadrant B | 26,253,901 | 6,410,906 |
| Events in quadrant C | 24,464,998 | 6,455,418 |
| Events in quadrant D | 74,036,115 | 5,037,405 |
| Mode M9 | |||
|---|---|---|---|
| Quadrant | BADHDUFLAG | Total packets | Discarded packets |
| A | 0 | 71 | 0 |
| B | 0 | 71 | 0 |
| C | 0 | 71 | 0 |
| D | 0 | 71 | 0 |
| Mode M0 | |||
|---|---|---|---|
| Quadrant | BADHDUFLAG | Total packets | Discarded packets |
| A | 0 | 114751 | 0 |
| B | 0 | 115066 | 0 |
| C | 0 | 112310 | 0 |
| D | 0 | 257527 | 0 |
| Mode SS | |||
|---|---|---|---|
| Quadrant | BADHDUFLAG | Total packets | Discarded packets |
| A | 0 | 1102 | 0 |
| B | 0 | 1102 | 0 |
| C | 0 | 1102 | 0 |
| D | 0 | 1102 | 0 |
| Quadrant | Total seconds | Saturated seconds | Saturation percentage |
|---|---|---|---|
| A | 54051 | 1350 | 2.497641% |
| B | 54065 | 1186 | 2.193656% |
| C | 54053 | 947 | 1.751984% |
| D | 54031 | 18348 | 33.958283% |
Noise dominated data is calculated using 1-second bins in cleaned event files. If a bin has >2000 counts, and if more than 50% of those come from <1% of pixels, then it is considered to be noise-dominated and hence unusable.
| Quadrant | # 1 sec bins | Bins with >0 counts | Bins with >2000 counts | High rate bins dominated by noise | Noise dominated (total time) | Noise dominated (detector-on time) | Marked lightcurve |
|---|---|---|---|---|---|---|---|
| A | 61168 | 54087 | 272 | 272 | 0.44% | 0.50% |  |
| B | 61168 | 54089 | 79 | 79 | 0.13% | 0.15% |  |
| C | 61168 | 54089 | 66 | 66 | 0.11% | 0.12% | 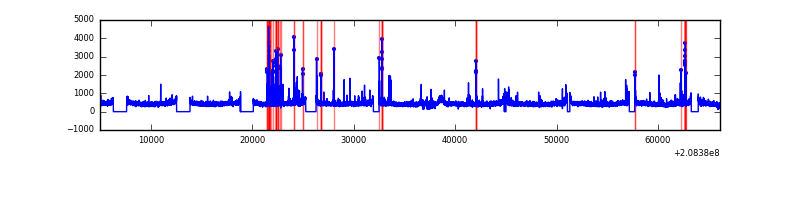 |
| D | 61168 | 54064 | 15574 | 15574 | 25.46% | 28.81% | 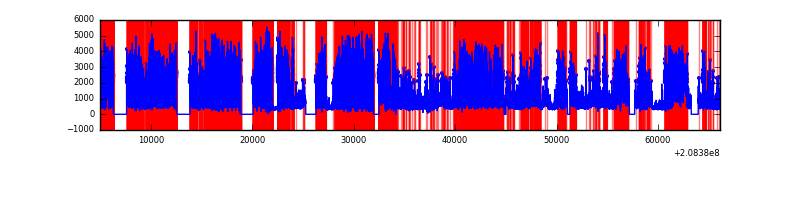 |
Top three noisy pixels from each quadrant. If the there are fewer than three noisy pixels in the level2.evt file, extra rows are filled as -1
| Pixel properties | Quadrant properties | ||||||
|---|---|---|---|---|---|---|---|
| Quadrant | DetID | PixID | Counts | Sigma | Mean | Median | Sigma |
| A | 14 | 111 | 1389441 | 1128.4 | 6074 | 5935 | 1226.1 |
| A | 12 | 133 | 92904 | 70.93 | 6074 | 5935 | 1226.1 |
| A | 8 | 15 | 85761 | 65.11 | 6074 | 5935 | 1226.1 |
| B | 15 | 204 | 1161313 | 994.09 | 6172 | 6010 | 1162.2 |
| B | 10 | 16 | 301184 | 253.98 | 6172 | 6010 | 1162.2 |
| B | 14 | 167 | 211885 | 177.15 | 6172 | 6010 | 1162.2 |
| C | 14 | 48 | 598824 | 430.76 | 6012 | 6032 | 1376.2 |
| C | 9 | 247 | 114997 | 79.18 | 6012 | 6032 | 1376.2 |
| C | 1 | 16 | 80590 | 54.18 | 6012 | 6032 | 1376.2 |
| D | 8 | 112 | 30022735 | 24629.59 | 5098 | 4943 | 1218.8 |
| D | 2 | 63 | 11340187 | 9300.56 | 5098 | 4943 | 1218.8 |
| D | 13 | 235 | 8554916 | 7015.25 | 5098 | 4943 | 1218.8 |
Histogram calculated using DETX and DETY for each event in the final _common_clean file
| Quadrant A |  |
 |
Quadrant B |
|---|---|---|---|
| Quadrant D |  |
 |
Quadrant C |
| Plot type | Count rate plots | Images |
|---|---|---|
| Comparison with Poisson distribution Blue bars denote a histogram of data divided into 1 sec bins. Red curve is a Poisson curve with rate = median count rate of data. |
 |
 |
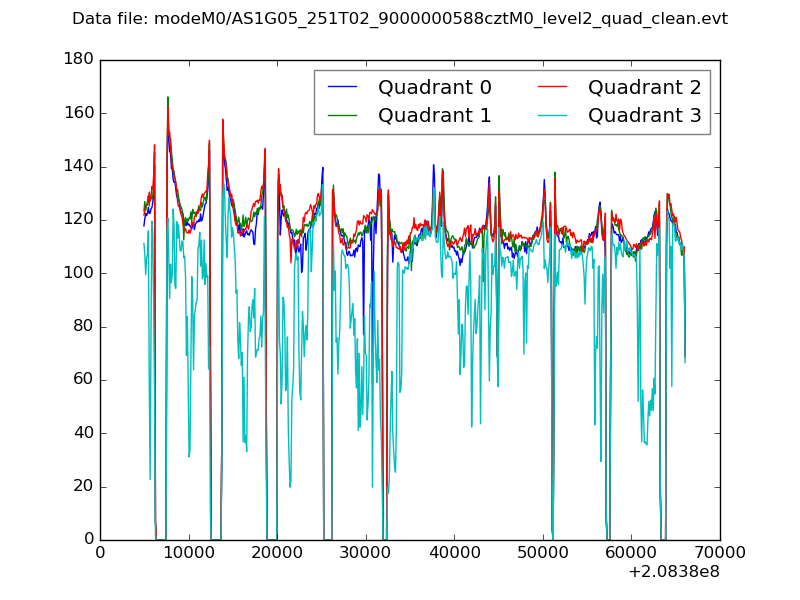
| Quadrant-wise count rates Data is divided into 100 sec bins |
 |
|
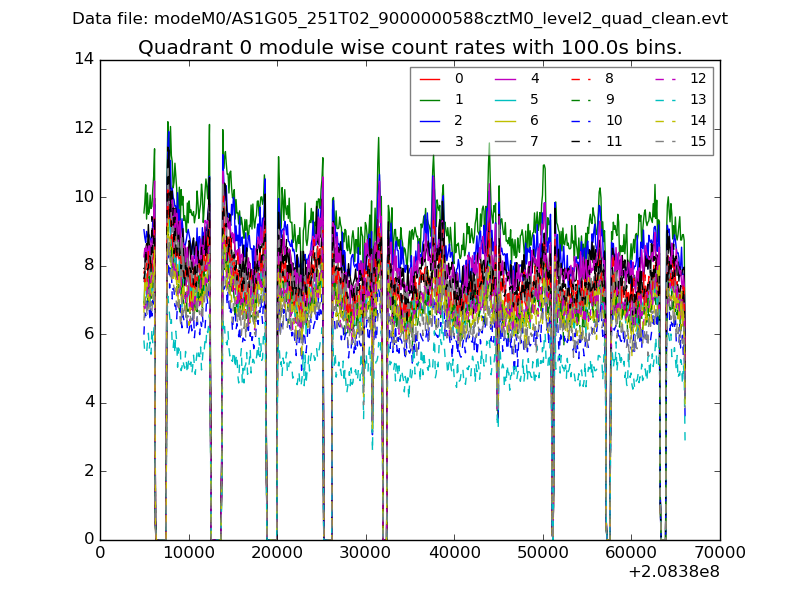
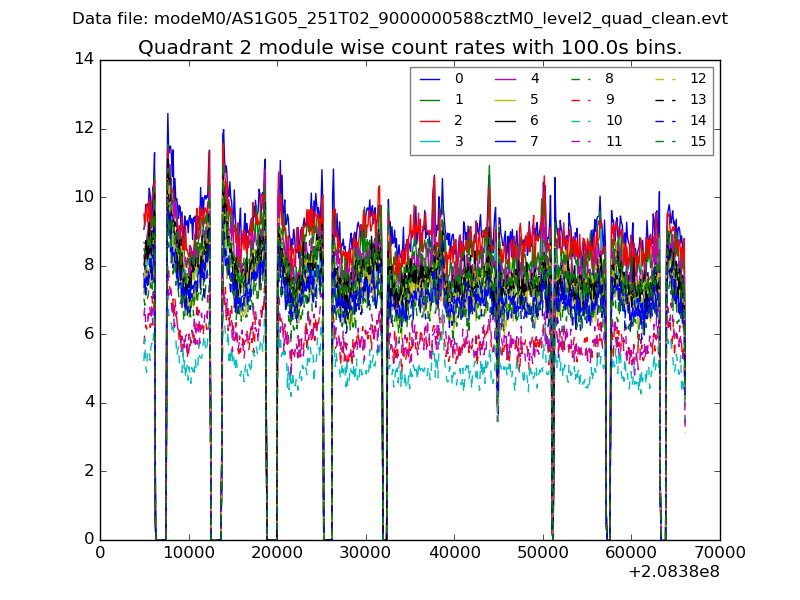
| Module-wise count rates for Quadrant A Data is divided into 100 sec bins |
 |
 |
| Module-wise count rates for Quadrant B Data is divided into 100 sec bins |
 |
 |
| Module-wise count rates for Quadrant C Data is divided into 100 sec bins |
 |
 |
| Module-wise count rates for Quadrant D Data is divided into 100 sec bins |
 |
 |
| Parameter | Plot |
|---|---|
| CZT HV Monitor |  |
| D_VDD |  |
| Temperature 1 |  |
| Veto HV Monitor | 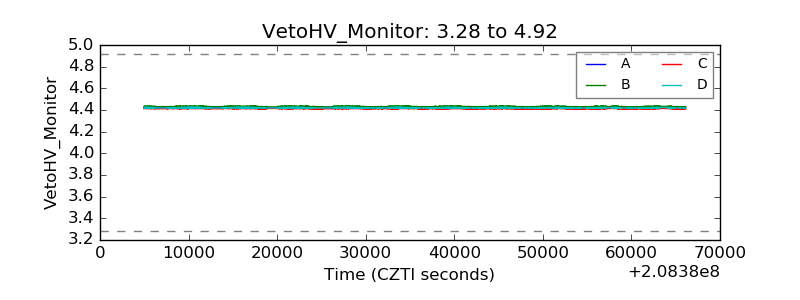 |
| Veto LLD |  |
| Alpha Counter |  |
| _CPM_Rate |  |
| CZT Counter | 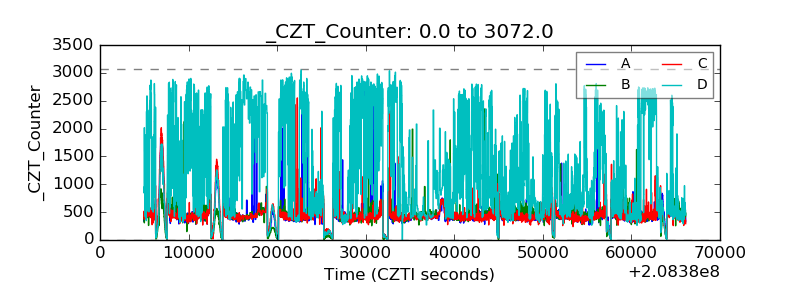 |
| +2.5 Volts monitor |  |
| +5 Volts monitor |  |
| _ROLL_ROT |  |
| _Roll_DEC | 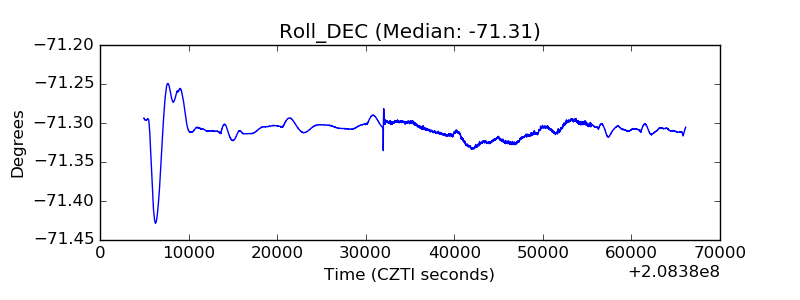 |
| _Roll_RA |  |
| Veto Counter | 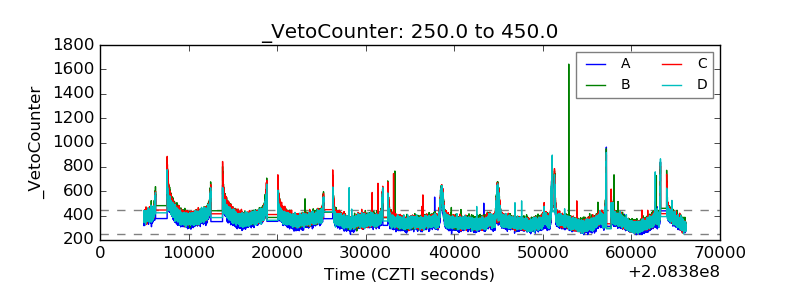 |