| Param | Original file | Final file |
|---|---|---|
| Filename | modeM0/AS1G05_215T01_9000000586cztM0_level2_bc.evt | modeM0/AS1G05_215T01_9000000586cztM0_level2_quad_clean.evt |
| Size (bytes) | 2,695,599,360 | 406,163,520 |
| Size | 2.5 GB | 387.3 MB |
| Events in quadrant A | 7,025,296 | 2,781,786 |
| Events in quadrant B | 8,099,490 | 2,816,860 |
| Events in quadrant C | 7,063,231 | 2,753,884 |
| Events in quadrant D | 56,893,500 | 1,368,065 |
| Mode SS | |||
|---|---|---|---|
| Quadrant | BADHDUFLAG | Total packets | Discarded packets |
| A | 0 | 766 | 0 |
| B | 0 | 766 | 0 |
| C | 0 | 766 | 0 |
| D | 0 | 766 | 0 |
| Mode M0 | |||
|---|---|---|---|
| Quadrant | BADHDUFLAG | Total packets | Discarded packets |
| A | 0 | 76789 | 0 |
| B | 0 | 78663 | 0 |
| C | 0 | 76779 | 0 |
| D | 0 | 259475 | 0 |
| Mode M9 | |||
|---|---|---|---|
| Quadrant | BADHDUFLAG | Total packets | Discarded packets |
| A | 0 | 52 | 0 |
| B | 0 | 52 | 0 |
| C | 0 | 52 | 0 |
| D | 0 | 52 | 0 |
| Quadrant | Total seconds | Saturated seconds | Saturation percentage |
|---|---|---|---|
| A | 37449 | 516 | 1.377874% |
| B | 37449 | 518 | 1.383215% |
| C | 37449 | 468 | 1.249700% |
| D | 37449 | 25335 | 67.652007% |
Noise dominated data is calculated using 1-second bins in cleaned event files. If a bin has >2000 counts, and if more than 50% of those come from <1% of pixels, then it is considered to be noise-dominated and hence unusable.
| Quadrant | # 1 sec bins | Bins with >0 counts | Bins with >2000 counts | High rate bins dominated by noise | Noise dominated (total time) | Noise dominated (detector-on time) | Marked lightcurve |
|---|---|---|---|---|---|---|---|
| A | 42779 | 37452 | 0 | 0 | 0.00% | 0.00% |  |
| B | 42779 | 37450 | 0 | 0 | 0.00% | 0.00% |  |
| C | 42779 | 37448 | 1 | 1 | 0.00% | 0.00% |  |
| D | 42779 | 37332 | 12533 | 12533 | 29.30% | 33.57% |  |
Top three noisy pixels from each quadrant. If the there are fewer than three noisy pixels in the level2.evt file, extra rows are filled as -1
| Pixel properties | Quadrant properties | ||||||
|---|---|---|---|---|---|---|---|
| Quadrant | DetID | PixID | Counts | Sigma | Mean | Median | Sigma |
| A | 8 | 15 | 107544 | 265.14 | 1786 | 1739 | 399.1 |
| A | 13 | 14 | 19308 | 44.03 | 1786 | 1739 | 399.1 |
| A | 12 | 194 | 15186 | 33.7 | 1786 | 1739 | 399.1 |
| B | 15 | 204 | 695969 | 1949.32 | 1817 | 1759 | 356.1 |
| B | 14 | 167 | 218119 | 607.53 | 1817 | 1759 | 356.1 |
| B | 0 | 219 | 95410 | 262.97 | 1817 | 1759 | 356.1 |
| C | 9 | 247 | 66148 | 161.23 | 1770 | 1735 | 399.5 |
| C | 9 | 68 | 20034 | 45.8 | 1770 | 1735 | 399.5 |
| C | 4 | 112 | 14315 | 31.49 | 1770 | 1735 | 399.5 |
| D | 8 | 112 | 49978875 | 204908.56 | 1016 | 970 | 243.9 |
| D | 2 | 63 | 1093956 | 4481.22 | 1016 | 970 | 243.9 |
| D | 13 | 239 | 526412 | 2154.3 | 1016 | 970 | 243.9 |
Histogram calculated using DETX and DETY for each event in the final _common_clean file
| Quadrant A |  |
 |
Quadrant B |
|---|---|---|---|
| Quadrant D | 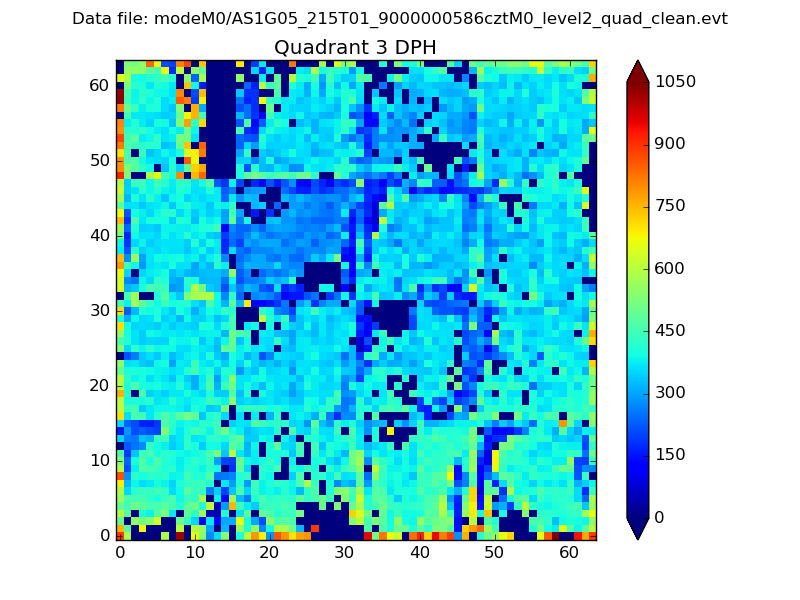 |
 |
Quadrant C |
| Plot type | Count rate plots | Images |
|---|---|---|
| Comparison with Poisson distribution Blue bars denote a histogram of data divided into 1 sec bins. Red curve is a Poisson curve with rate = median count rate of data. |
 |
 |
| Quadrant-wise count rates Data is divided into 100 sec bins |
 |
|
| Module-wise count rates for Quadrant A Data is divided into 100 sec bins |
 |
 |
| Module-wise count rates for Quadrant B Data is divided into 100 sec bins |
 |
 |
| Module-wise count rates for Quadrant C Data is divided into 100 sec bins |
 |
 |
| Module-wise count rates for Quadrant D Data is divided into 100 sec bins |
 |
 |
| Parameter | Plot |
|---|---|
| CZT HV Monitor |  |
| D_VDD | 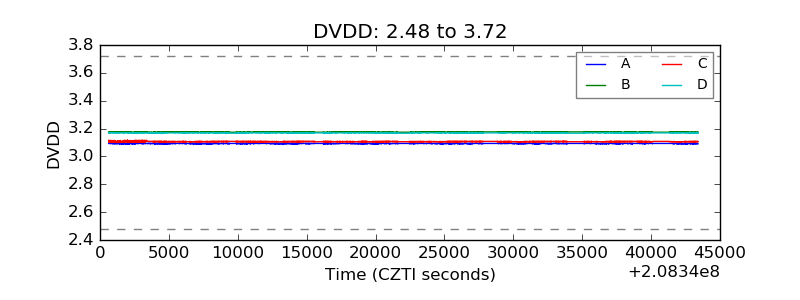 |
| Temperature 1 |  |
| Veto HV Monitor |  |
| Veto LLD | 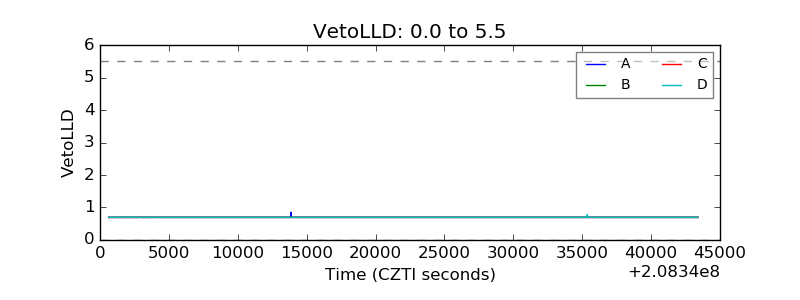 |
| Alpha Counter |  |
| _CPM_Rate |  |
| CZT Counter |  |
| +2.5 Volts monitor |  |
| +5 Volts monitor |  |
| _ROLL_ROT | 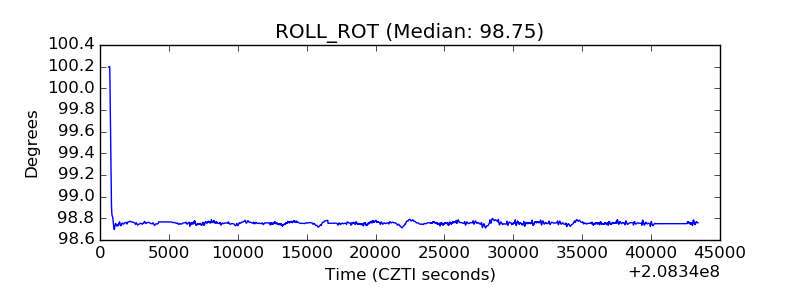 |
| _Roll_DEC |  |
| _Roll_RA |  |
| Veto Counter |  |